A call to action (CTA) is a short phrase that tells your audience what to do next. It often contains a clickable link either in text or a button.
Changing a CTA from a plain text link to a button can boost conversions by about 45%, and using contrasting CTA colors has been shown to increase conversions by around 21% in many tests. Email campaigns with a single focused CTA have been shown to increase click-through rates by up to 371% compared to campaigns with multiple CTAs.
Calls to action can make or break your online conversions. If used right, they can persuade people to take instant action and turn browsing into buying.
In this post, we’ll discuss interesting CTA statistics that show how simple design and wording tweaks can make a big difference in boosting your website clicks and conversions.
Table of Contents
- Key Call to Action Statistics (2026)
- CTA Impact on Conversions & Engagement Statistics
- CTA Placement & Visibility Stats
- CTA Brand Color Insights & Statistics
- CTA Personalization & Dynamic
- CTA Urgency & Scarcity Tactics Stats
- Mobile & Multi-Channel CTA Optimization Statistics
- CTA Copywriting Statistics
- Landing Page CTA Performance Stats
- CTA Readability & Conversion Rate Stats
- Call to action marketing stats
- Key Takeaways on CTAs
- Final thoughts on call-to-action trends
- FAQs on Call to Action Stats 2026
Key Call to Action Statistics (2026)
- Emails with a single CTA get up to 371% more clicks than emails with multiple CTAs.
- Personalized CTAs convert over 200% better than generic calls to action.
- CTA buttons outperform text links, increasing click-through rates by up to 45%.
- High-contrast CTA colors significantly improve visibility and conversion rates.
- Mobile-optimized CTAs (larger, easy-to-tap buttons) drive higher engagement and conversions.
- Clear and simple CTA copy written in plain language converts better than complex or professional wording.
CTA Impact on Conversions & Engagement Statistics
70% of small and mid-sized business owners don’t use CTAs in their marketing emails.
Including a clear call to action in your email can boost sales by 1,617% and increase the number of people clicking links by 370%.
Source: Digital Oasis
Switching from a plain text link to a clear call-to-action button increases clicks by 28%.
Example: Replacing “Learn more” with a “Get Started Now” button makes more people take action faster.
In fact, Campaign Monitor received a 127% increase in click-throughs when they used a CTA button instead of a text link.
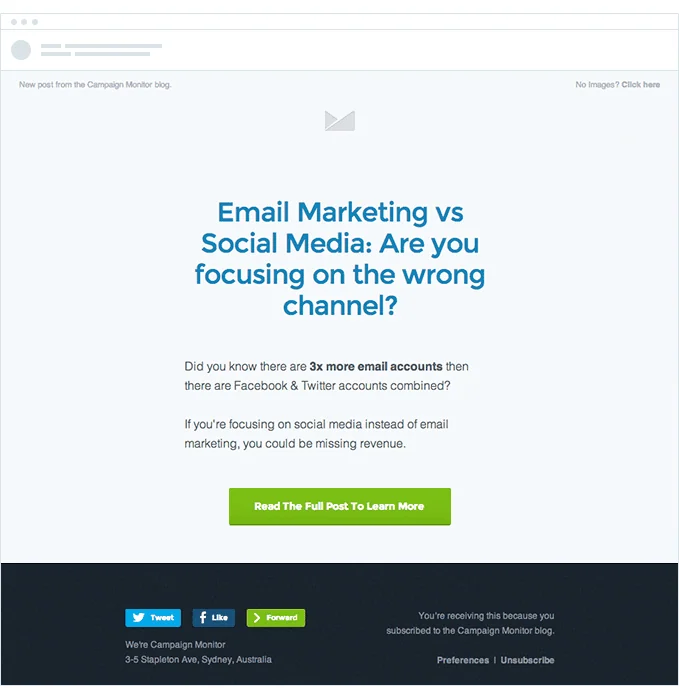
Source: Campaign Monitor
Tests show that first-person CTA phrasing like “Start my free trial” can significantly increase engagement compared to generic phrasing, according to Unbounce.
CTA Placement & Visibility Stats
CTAs work best when they’re placed strategically. Placing CTAs prominently, such as at the end of product pages or above the fold, has been linked to increases in conversions, with some experiments showing gains of 70% or more over less visible placements, while inline CTAs inside content perform 121% better than those in sidebars.
Keeping just one CTA per page can boost conversions by 266%. Welcome Gates has the highest average conversion rates, ranging from 10% to 25%.
Here’s what a welcome gate on a website looks like;

Here’s a table showing different placements and the average conversion rates for each of them.
| Promotion Type | Average Conversion Rate |
|---|---|
| Welcome Gates | 10% – 25% |
| Pop-ups | 3.7% – 13.6% |
| Feature Boxes | 3% – 9% |
| Sidebars | 0.4% – 1.8% |
| Inline Links | 0.2% – 0.8% |
Source: Sender
CTA Brand Color Insights & Statistics
Studies show many consumers are influenced by button color and contrast when deciding where to click, with high-contrast designs significantly improving visibility and engagement. Blue is the #1 preferred color, followed by Black/Grayscale, which is preferred by 28% of top brands.
Importance of Color in Consumer Behavior
90% of consumers say color influences impulse buys.
Here’s a table showing the importance of colors in branding.
| Aspect | Percentage |
| Brand Recognition | 80% |
| Brand Preference | 85% |
| Visual Appearance | 93% |
| Primary Purchase Driver | 85% |
| Impulse Buys | 90% |
Most Preferred Colors by Top Brands
Blue is the most preferred color by top brands globally (33%), and purple is the least preferred color, with only 0.8% of top brands using it.
Here’s a breakdown of the most preferred colors by top brands globally.
| Color | Percentage |
| Blue | 33% |
| Black/Grayscale | 28% |
| Red | 23.4% |
| Yellow | 15.6% |
| Green | 5.5% |
| Purple | 0.8% |
Source: Straits Research
CTA Personalization & Dynamic
Using persuasive words in CTAs can boost your conversions significantly.
Personalized CTAs tailored to user behavior or intent can convert significantly better than generic ones, over 200% higher in some HubSpot analyses.

Learn about the common mistakes affiliates make and quick fixes to improve your sales and strategies.
CTA Urgency & Scarcity Tactics Stats
Urgency elements such as limited-time messaging have been shown to greatly increase conversion rates, with some experiments reporting 300%+ lift when urgency and scarcity are clearly communicated.
Flash sales can boost your conversion rates by over 35% compared to regular offers, and showing how many items are left can increase sales by more than 20%. This is the reason why people buy products worth billions during special events like Black Friday, Cyber Monday, etc.
Seeing a “Low Stock” alert makes people act fast, as 78% of customers say it creates a strong urge to buy.
In fact, using more than one urgency trigger can boost your overall conversions.
Here’s the table showing the impact of different urgency triggers on buyers.
| Urgency Trigger | Percentage of Buyers Affected |
| “Low Stock” alerts | 78% |
| “X people are looking at this now” | 45% |
| “X users have looked at this today” | 40% |
| “X users have bought this today” | 23% |
The psychological principle, known as the “mere urgency effect,” can boost sales by up to 332%. For example, when an online store adds a “limited-time offer” timer, shoppers tend to buy faster to avoid missing out.
Sources: Abmatic, M Accelerator, Convertica
Mobile & Multi-Channel CTA Optimization Statistics
Optimizing CTAs for mobile devices (better size, spacing, and visibility) improves conversion rates, with mobile-focused CTAs showing significantly higher engagement in many tests. This is because mobile-friendly CTAs are bigger and easier to tap compared to desktop.
Websites that load in 2 seconds or less see a 15% higher conversion rate on mobile, and users are 37% more likely to buy from a site that’s mobile-friendly.
Here are some quick ways to optimize CTAs for mobile users.
- Always choose mobile-responsive themes that work well across all devices
- Use floating action button plugins for WordPress, such as Buttonizer, as they boost interactions and conversions from mobile.
- Optimize CTA button text for mobile users by using short yet persuasive words like “Act Now”, “Grab Copy”, “Download”, etc.
Here are some interesting stats on CTAs for different channels:
Social media ads with clear CTAs get 285% more clicks than average.
Including a CTA within videos can boost clicks by over 380% compared to the CTAs used in the sidebar.
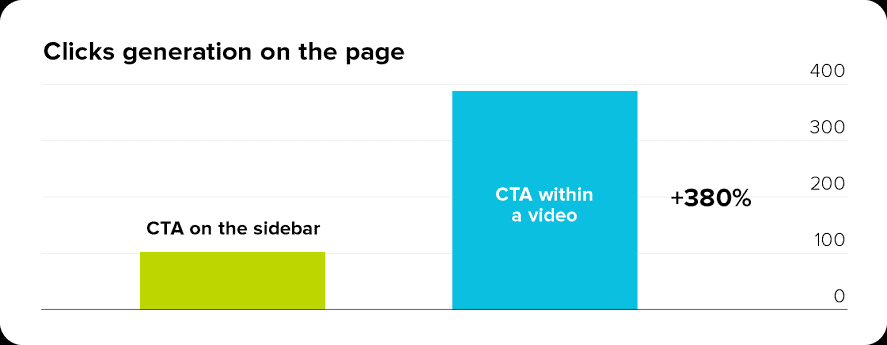
Sources: Wiser Notify, Landingi
CTA Copywriting Statistics
By using contrasting colors on CTA buttons, you can increase conversions by up to 45%.
Here’s a table showing key CTA copywriting statistics and their impact on conversions.
| CTA Strategy | Result |
| Use a bright, different color for your CTA button | Conversions go up by 45% |
| Keep your CTA clear and easy to see | Boosts conversions by 47% |
| Use only one CTA per email | Sales go up by 1,617% and clicks by 371% |
| Remove extra clutter near your CTA | Conversions increase by 232% |
| Add CTAs to your social media pages | Click-through rate goes up by 285% |
Source: Owner’s Mag
Landing Page CTA Performance Stats
The average conversion rate for landing pages across all industries is 6.6%. The Events and Entertainment industries have the highest conversion rate, averaging 12.3%.
Personalized calls-to-action (CTAs) convert 202% better than generic CTAs and adding a video on landing pages improves conversions by 86%.
Want to master on-page SEO? Learn step-by-step tactics to optimize your posts and boost rankings fast.
HubSpot research reveals that business websites with 10 to 15 landing pages see a 55% boost in conversions compared to those with fewer than 10.
Landing pages perform best for signups, with an average rate of 6.47%, beating popups at 3.77%, flyouts at 3.24%, and embedded forms at 1.28%.
Sources: Unbounce, Meetanshi, Omnisend
CTA Readability & Conversion Rate Stats
Pages written at a 5th–7th grade level convert 11.1% better, which is 56% higher than 8th–9th grade content and over twice as effective as “professional” language.

Here’s a table showing how conversion rates increase as CTA readability improves across different reading levels.
| Reading Level | Difficulty | Conversion Rate |
| 5th–7th grade | Easy | 11.1% |
| 8th–9th grade | Average | 7.1% |
| 10th–12th grade | Hard | 6.1% |
| College–University | Very Hard | 5.3% |
| Professional | Extremely Hard | 5.5% |
Source: Unbounce
Call to action marketing stats
Using a single CTA always works best for engagement rates, overall click-through rates, and conversions.
In fact, a single CTA receives 371% more clicks than emails with multiple calls to action.
Source: Campaign Monitor
Increasing the size of your call-to-action button can boost click-through rates by up to 90%. So, CTA button size is a key factor in boosting conversions.
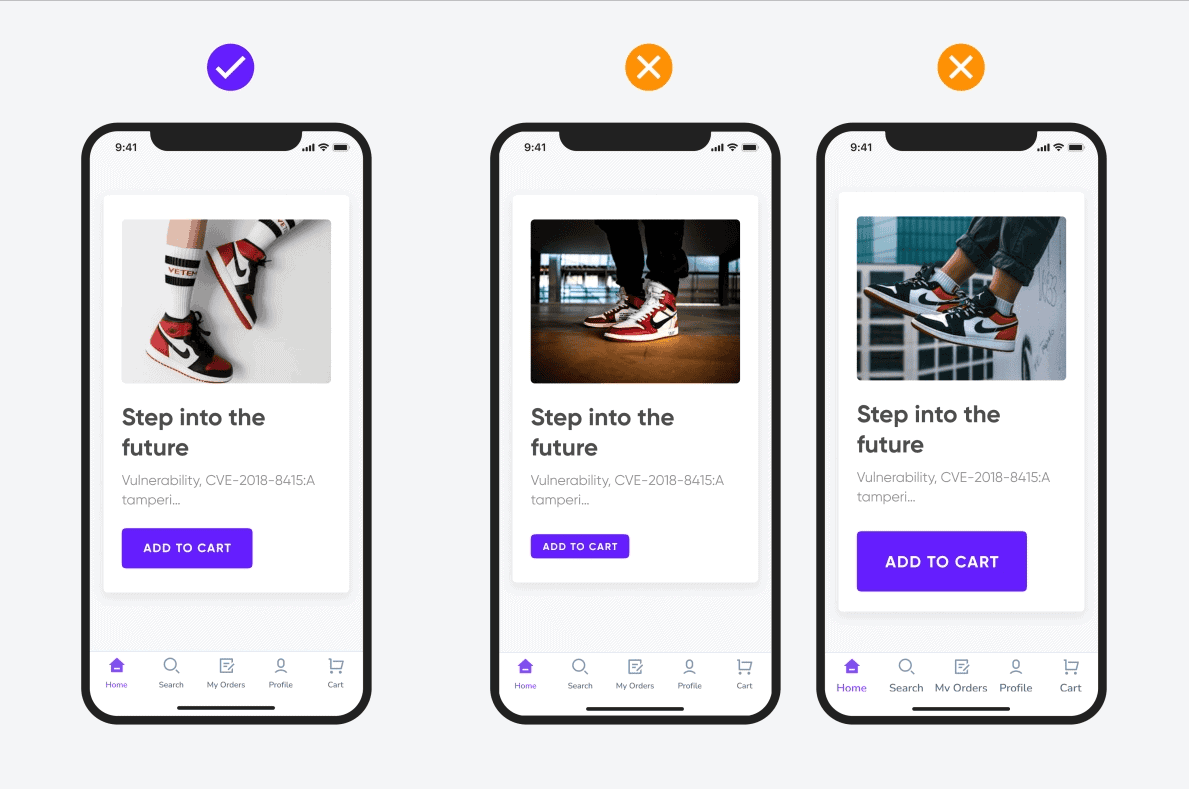
Here are the key official design standards for CTA button sizing.
- Apple recommends a minimum button size of 44px by 44px to be easy to tap.
- Google suggests a slightly larger minimum size of 48px by 48px for better touch accuracy.
- WCAG guidelines recommend buttons be at least 44px by 44px to meet high accessibility standards.
Source: Wiser Notify
Placing CTAs right after testimonials increases website conversions by 25% because users feel more trust after reading positive reviews.
Source: Amra and Delma
Key Takeaways on CTAs
- CTA button color matters: Blue outperforms all the remaining colors by 33%, while purple performs the least and is used by only 0.8% of brands.
- Headlines matter: 90% of people who read your headline will also read your call to action.
- Use Welcome Gates: If you want better conversions from CTAs, use Welcome Gates (conversion rates can reach up to 25%).
- Strong CTA text matters: The average website converts only 2.4% of visitors, but a strong CTA can boost it to 11.5% or higher.
Final thoughts on call-to-action trends
Personalization, visual design, and the usage of persuasive words make a huge difference in your CTA success.
Personalized CTAs convert 200%+ better than generic ones, helping you boost conversions by crafting them for your users’ needs.
Using strong action words adds urgency to your CTAs, boosting click rates by 20-90%.
What are your thoughts on the CTA stats listed above? Have any questions? Let us know in the comments.
FAQs on Call to Action Stats 2026
Here are some of the frequently asked questions about call to action.
A strong call to action is highly effective, as it can boost click-through rates by up to 370% when it is clear and placed correctly.
A well-placed call to action can boost your sales and revenue by up to 83% and conversions by up to 11.5%.
Good examples of CTA include phrases like “Start your free trial,” “Enroll now,” or “Get my guide”, which can encourage people to take action.
Pages with one clear call to action often convert better, up to 266% higher compared to the pages using multiple CTAs.
“Buy Now,” “Subscribe Today,” and “Download Free eBook” are some examples of CTAs.
Call-to-action buttons above the fold get 304% more conversions, and red buttons outperform green ones by about 17%. Blue color CTAs perform the best and are used by 33% of brands.
Divide the number of clicks on your CTA by the total visitors to that page, then multiply that by 100 to get the click-through rate.