Software-as-a-service (SaaS) is gaining popularity, as it dominates the cloud computing market.
From HR to IT to marketing, SaaS is growing in almost every industry. The SaaS market is projected to reach over 819.2 billion by 2030.
Last year, the SaaS market generated over $250 billion in revenue, with organizations using an average of 106 SaaS tools each. The US leads the SaaS market, and India is growing rapidly, with the market expected to reach over $26 billion in revenue by 2026.
In this post, we’ll uncover some of the top SaaS industry trends along with their adoption, revenue, overall global market, and more.
Table of Contents
Top SaaS Industry Statistics You Should Know in 2026
- Microsoft, Apple, Google, Amazon, and Oracle are the top 5 market leaders in the SaaS market.
- On average, organizations use around 106 different SaaS applications to manage their operations, workflows, and digital processes.
- Enterprise companies (managing 1000+ employees) spend between $20 million and over $100 million, managing 275+ SaaS tools.
- 96% of companies/brands use at least one SaaS tool, and nearly 8 in 10 companies use more than four SaaS tools.
Global SaaS Market Size and Growth
The global SaaS market was valued at USD 399.1 billion in 2024 and is expected to reach $819.2 billion by 2030, growing at a 12% CAGR. Increased adoption of public cloud services is a key driver of this growth.
The global spending on SaaS marketing is projected to reach $295.08 billion by 2026.
Worldwide SaaS spending is up 19.4% year over year.
| Cloud Segment | 2023 Spending (USD) | 2023 Growth (%) | 2024 Spending (USD) | 2024 Growth (%) | 2025 Spending (USD) | 2025 Growth (%) |
|---|---|---|---|---|---|---|
| Cloud Application Infrastructure Services (PaaS) | 142,934 | 19.5 | 172,449 | 20.6 | 211,589 | 22.7 |
| Cloud Application Services (SaaS) | 205,998 | 18.1 | 247,203 | 20.0 | 295,083 | 19.4 |
| Cloud Business Process Services (BPaaS) | 66,162 | 7.5 | 72,675 | 9.8 | 82,262 | 13.2 |
| Cloud Desktop-as-a-Service (DaaS) | 2,708 | 11.4 | 3,062 | 13.1 | 3,437 | 12.3 |
| Cloud System Infrastructure Services (IaaS) | 143,302 | 19.1 | 180,044 | 25.6 | 232,391 | 29.1 |
| Total Market | 561,104 | 17.3 | 675,433 | 20.4 | 824,763 | 22.1 |
As of 2026, the AI-Created SaaS market is projected to be worth $101.73 billion. It is expected to reach $1040.62 billion by 2032, with a whopping CAGR of 39.4%.
Machine learning holds the largest share among technologies in the 2026 AI-created SaaS market with an estimated market revenue share of 41.3%.
Sources: Statista, Gartner, Coherent Market Insights
SaaS Adoption & Usage Statistics
In 2024, organizations used an average of 106 SaaS tools, marking a 5% year-over-year decline from 112 SaaS apps in 2023. The trend shows a gradual decrease in the number of SaaS tools used over the years, with further declines predicted for 2026.

Here’s a table showing the average number of SaaS apps used by organizations since 2020:
| Year | Number of SaaS Tools Usage |
|---|---|
| 2020 | 80 |
| 2021 | 110 |
| 2022 | 130 |
| 2023 | 112 |
| 2024 | 106 |
| 2025 (est.) | 100 |
| 2026 (est.) | 95* |
Average number of SaaS apps by company size:
Smaller companies with 75 to 199 employees used an average of 44 SaaS apps in 2024 (compared to 42 apps in 2023).
Mid-to-large companies saw the biggest reduction in SaaS app usage, with organizations of 1,500 to 4,999 employees cutting their app usage by nearly 29% in 2024.
Here’s a table showing the average number of SaaS app usage by company size.
| Company Size (Employees) | Avg. SaaS Apps (2023) | Avg. SaaS Apps (2024) | Change |
|---|---|---|---|
| 75–199 | 42 | 44 | +2 |
| 200–749 | 103 | 96 | -7 |
| 750–1,499 | 116 | 86 | -30 |
| 1,500–4,999 | 142 | 101 | -41 |
| 5000+ | 158 | 131 | -27 |
Source: BetterCloud
Number of SaaS companies in the world
There are more than 80,000 SaaS companies worldwide. Most of these SaaS companies are based in the United States, totaling over 30,800.
Here’s the table showing the top countries by the number of SaaS companies worldwide.
| Name | SaaS Companies | Total Revenue | Total Funding |
| United States | 30,800 | $410.1 billion | $291.7 billion |
| United Kingdom | 4,500 | $28.4 billion | $13.6 billion |
| Germany | 2,900 | $14.5billion | $7.6 billion |
| India | 2,400 | $27.5 billion | $9.4 billion |
| Canada | 2,100 | $15.8 billion | $8.1 billion |
Currently, the leading players in the SaaS market are Microsoft, Apple, Google, Amazon, and Oracle.
Here’s the table showing the top 5 SaaS companies along with their key stats.
| Name | Founded In | CEO | Market Cap | Revenue |
| Microsoft | 1975 | Satya Nadella | $3.85 trillion | $281.7 billion |
| Apple | 1976 | Tim Cook | $3.83 trillion | $391.04 billion |
| 1988 | Sundar Pichai | $2.97 trillion | $348.5 billion | |
| Amazon | 1994 | Andy Jassy | $2.34 trillion | $670.04 billion |
| Oracle | 1977 | Safra Catz | $815.73 billion | $57.4 billion |
About 60% of SaaS companies are in the US, which has around 54 billion SaaS customers, including repeat users.

Here’s a table showing the SaaS customers by country.
| Country | SaaS Customers (Including Repeat Users) |
| US | 54 billion |
| China | 3 billion |
| UK | 3 billion |
| Canada | 3 billion |
| India | 2 billion |
| Germany | 2 billion |
| France | 1 billion |
Sources: Latka
SaaS Marketing Statistics
Almost all companies now rely on SaaS tools, with approximately 96% using at least one and 78% using four or more.
The top five most frequently paid-for SaaS apps are Udemy, ChatGPT, Canva, Kudoboard, and CliftonStrengths.
Here’s the list of the top 10 most-expensed SaaS applications with their average customer spends and usage trends as of 2026;
| SaaS Product | Average Monthly Cost | Average spend per user | Estimated Total Users |
| Udemy | Starts at $20–35 monthly | $10 per user/year | 79 million |
| ChatGPT | $20/month (Plus), $25–30 Business | $240 per user/year | 700-800 million (weekly active users) |
| Canva | $15/user (Pro), $10/user (Teams) | $120–150 per user/year | 220+ million(monthly active users) |
| Kudoboard | Starts at $25/month | ~$300 per user/year | 60,000+ organizations (10+ million users) |
| CliftonStrengths | $25 per assessment (one-time); custom team sessions $1,400+/group | Not Available | Over 36 million |
| $29.99 to $139.99/month (Premium plans) | Avg ~$720 per user/year | 1.15 billion monthly active users | |
| OpenAI API | o3-mini: $1.10–$4.40 per 1M tokens; o3: $10–$40 per 1M tokens | $50/month average developer spend | 1.8 million+ developers |
| Grammarly | $12/month (annual plan), $30/month (flexible) | $144 per user/year | Over 40 million |
| Adobe Acrobat | $22.99–$29.99/month (Standard/Pro) | $275 per user/year | 700 million+ users (Reader + paid) |
| Kahoot | $15–$30/month (individual plans) | ~$180–$360 per user/year | 8 billion participants total; 100 million+ active users |
Sources: Zylo, Latka, Exploding Topics
As of 2026, approximately 7% of all SaaS applications incorporate AI features, indicating the significant impact of AI on the SaaS industry.
Source: Better Cloud
About 92% of SaaS companies plan to expand the use of AI in their products. Over 76% of private SaaS companies report using at least some AI in their products.
Here’s another interesting fact: companies using AI in daily operations are more likely to be profitable: 61% reported operating at breakeven or better, compared to 54% for those not using AI.
Source: SaaS Capital
Around 70% of organizations now prefer SaaS management platforms that let them create fully customized automations.
Using a SaaS management platform for automation can boost overall IT productivity by about 49%. It simply means that using SaaS apps not only saves time but they reduces overall manual work.
Source: Better Cloud
Biggest SaaS Security Concerns
Leakage of sensitive data is the primary security concern for SaaS, cited by 44% of automation leaders.

Here’s a table showing the biggest SaaS security concerns.
| SaaS Security Concern | Percentage (Automation Leaders) |
| Unsanctioned SaaS apps that store sensitive data | 44% |
| Not knowing where sensitive data exists | 38% |
| Excessive admin privileges | 36% |
| Insider threats (malicious or negligent) | 26% |
| Sensitive files shared publicly | 26% |
| SaaS apps with read/write access to data | 10% |
| Former employees retaining data access | 10% |
| Sensitive emails forwarded to personal emails | 8% |
| Groups or calendars shared publicly | 3% |
Source: BetterCloud
SaaS Financial & Spending Insights
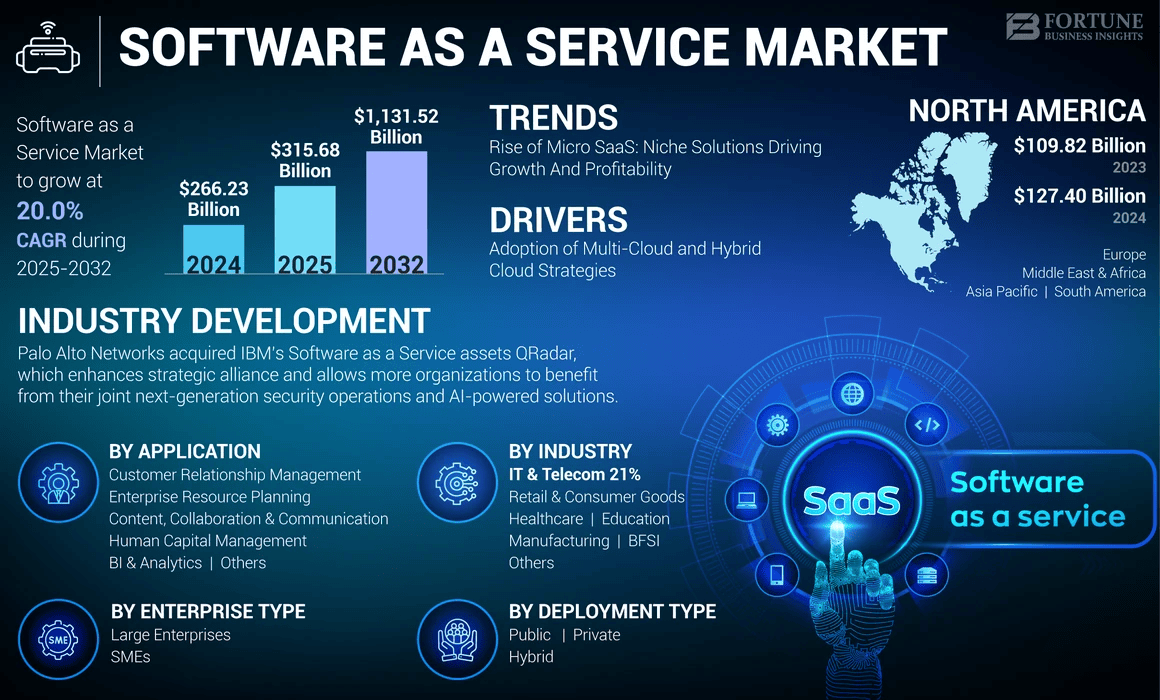
North America dominates the global SaaS market with a share of 47.85%.
The key drivers of the SaaS market include the adoption of multi-cloud and hybrid cloud strategies.
Source: Fortune Business Insights
According to IDC research, SaaS applications will make up over 40% of public cloud spending, with a 16.5% CAGR through 2028.
On average, businesses now spend about $1,000 to $3,500 per employee each year on SaaS tools.
Startups spend about $250K to $1 million yearly on SaaS, often using 95–107% of ARR, with most going to R&D (22%), sales (13%), and G&A (14%). Midsize companies spend $1 million to $15 million, investing 20% more on sales and 40% more on marketing.
Here’s a table showing how annual SaaS spending varies by company size.
| Company Type | Employee Range | Annual SaaS Spend Range |
| Startups | 1–100 employees | Around $250,000 to $1 million |
| Midsize Companies | 100–1,000 employees | Around $1 million to $15 million |
| Enterprise Companies | 1,000+ employees | Around $20 million to $100+ million |
Source: Cloud Eagle
SaaS Pricing Stats
82% of SaaS companies display their pricing on their websites.
Here’s a table summarizing the SaaS pricing statistics.
| Pricing Statistic | Percentage / Adoption |
|---|---|
| SaaS companies prefer fixed pricing | 44% |
| SaaS companies prefer variable pricing | 34% |
| SaaS companies preferring variable pricing | 24% |
| SaaS companies using usage-based pricing | 56% |
| SaaS companies offering freemium options | 48% |
| Companies offering annual subscription discounts | 40% |
| Companies listing prices on their website | 82% |
Did you know? According to the Call to Action Statistics 2026 Report, ‘Welcome Gates CTA’ has the highest average conversion rate among all CTA types, ranging between 10% and 25%.
Sources: Maxio, FastSpring, SaaS Academy
SaaS Spending Insights
The average annual recurring revenue spent on sales is 13%, up from 10.5%.
The average web hosting costs by SaaS companies account for 5% of their total annual recurring revenue.
Here’s the table showing the SaaS Company Spending by department (compared to the previous year).
| Category | % of Annual Recurring Revenue (Current Year) | Previous Year |
| Sales | 13% | 10.5% |
| Marketing | 8% | 8% |
| Customer Support & Success | 8% | 8.5% |
| Hosting | 5% | 5% |
| DevOps | 4% | 4% |
| Pro Services CoGS | 5% | 4% |
| Other CoGS | 2% | 2% |
| Research & Development | 22% | 18% |
| General & Administrative Costs | 14% | 11% |
Source: SaaS Capital
SaaS Trends for 2026
AI, the computing market, and low-code development are becoming the new SaaS trends that will drive the industry in 2026.
Artificial Intelligence
AI is transforming the SaaS market, and more SaaS tools are now using AI to improve their software. With the global artificial intelligence market size of $3,497.26 billion by 2033, AI is transforming the shape of the SaaS industry.
Security in SaaS
Security in the SaaS industry is a top priority, as ransomware attacks have increased by 13% over the last five years. Only 26% of companies use automated tools to monitor them. The SaaS security market was valued at approximately $8.55 billion in 2024 and is projected to reach $35 billion by 2035.
Low-Code Development
Low-code and no-code tools, such as Vibe coding tools, are reshaping the SaaS market by helping startups launch apps/websites faster with minimal coding. Additionally, the low-code market is growing rapidly, with the market expected to reach $187 billion by 2030.
Conclusion
The US leads the global SaaS market with billions of repeat customers and continues to launch thousands of new SaaS apps. The US SaaS market alone is expected to reach over $445 billion by 2029.
Also, the average B2B SaaS churn rate is around 1.59%, indicating strong customer retention in this market.
With the rise of AI, the usage of SaaS tools is also going up worldwide. Most businesses worldwide are spending a lot of money ($1,000 to $3,500) per employee each year on SaaS apps.
What are your thoughts on the SaaS usage trends? Did you find these stats on Software as a Service helpful? Let us know if you’ve any more questions in the comments.
Frequently Asked Questions
Here are some frequently asked questions about the SaaS market and its usage trends.
SaaS (Software as a Service) is a cloud computing service model in which individuals or organizations access software over the internet rather than installing it locally.
The global SaaS market is expected to reach USD 819.2 billion by 2030.
Adobe is one of the largest SaaS companies, with a market capitalization of $145 billion, revenue of $19.4 billion, and over 29,000 employees.
Currently, over 30,800 SaaS companies are operating in the US alone.
By the end of 2026, it is expected that 99% of companies will use at least one SaaS solution.