The Internet is growing rapidly. Every second, 3 new websites are created, adding to the billions already online.
With such a huge growth, understanding how people use websites is essential for businesses, bloggers, and marketers.
Whether you want to track website performance, understand the target audience, or stay ahead of the competition, you need to study the numbers.
In this guide, we’ll explore the latest website Stats for 2026. You’ll get expert-curated stats on website growth, usage, and future trends.
Table of Contents
Key Website Statistics for 2026: Our Top Picks
- As of 2026, in total, there are over 1.4 billion websites on the internet.
- English is the most used language on the web, powering 55.6% of all websites.
- The internet grows fast, with around 252,000 new websites created every day.
- That equals 10,500 websites per hour, 175 per minute, and 3 every second.
- Only 15% of websites are active, while the remaining 85% are parked or inactive.
How Many Websites Are There?
As of 2026, there are approximately 1.4 billion websites worldwide, but only 15% are active.
Every day, over 252,000 new websites are created. That means around 10,500 new sites go live every hour, 175 every minute, and nearly 3 every second.

Here’s the breakdown of the total Number of Websites by year:
| Year | All Websites (Billion) | Active % |
|---|---|---|
| 2025 | 1.161 B | 16.79% |
| 2024 | 1.079 B | 17.83% |
| 2023 | 1.073 B | 18.52% |
| 2022 | 1.036 B | 19.04% |
| 2021 | 1.025 B | 18.30% |
| 2020 | 1.030 B | 18.35% |
| 2019 | 1.039 B | 18.58% |
| 2018 | 1.060 B | 18.44% |
| 2017 | 1.065 B | 16.42% |
| 2016 | 0.967 B | 17.59% |
| 2015 | 0.861 B | 19.47% |
| 2014 | 0.860 B | 20.98% |
| 2013 | 0.673 B | 27.12% |
| 2012 | 0.647 B | 23.99% |
| 2011 | 0.547 B | 46.76% |
| 2010 | 0.256 B | 80.40% |
| 2009 | 0.238 B | 77.86% |
| 2008 | 0.173 B | 43.88% |
Website Usage Statistics
Approximately 68.7% of the global population uses the internet. Google is the most visited website in the world.
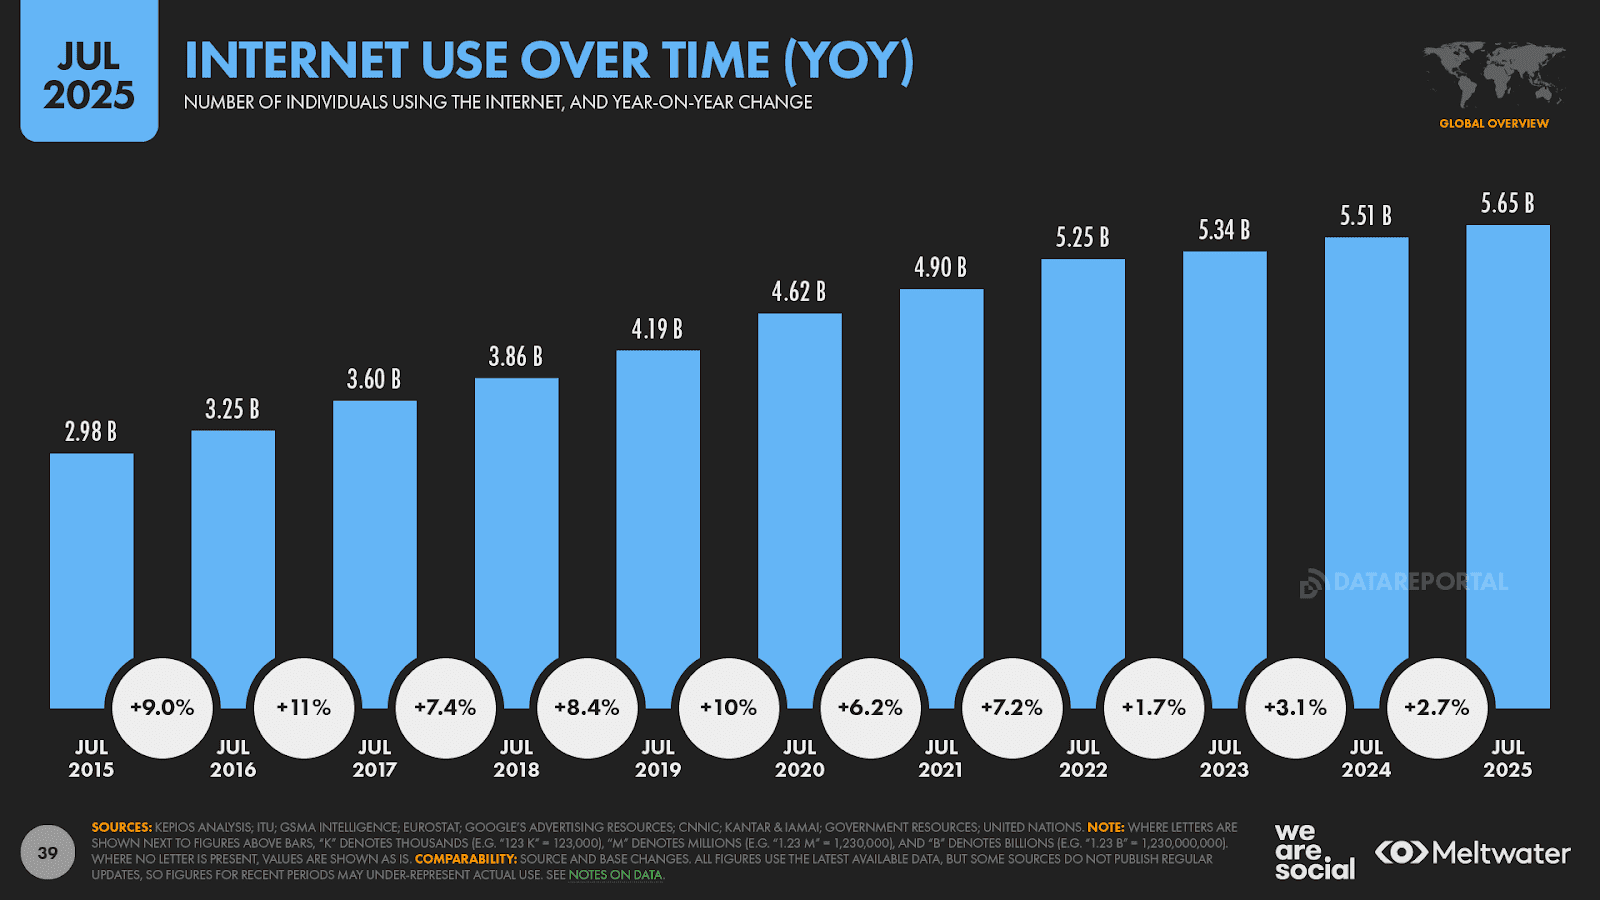
Over 5.65 billion people (68.7%) worldwide are using the internet.
The number of global internet users increased from 2.98 billion in 2015 to 5.65 billion by 2026. Growth was strong in earlier years (around 9 to 11% yearly) but has slowed recently, with only 2.7% growth in the past year.
Reddit is the 7th most visited website globally, with over 4+ billion visits per month. To explore detailed insights, check out our latest post on Reddit Statistics 2026.
Here are some more interesting facts about global internet usage;
- Total internet users: 5.65 billion (68.7% of the world population)
- Year-on-year growth: +2.7% (+146 million users)
- Female internet users: 66.5% (+3.7% YOY)
- Male internet users: 70.8% (+2.7% YOY)
- Average weekly online time per user: 33 hours 42 minutes
- Users accessing the internet via mobile: 95.9%
- Users accessing the internet via laptop/desktop: 60.7%
- Urban population using internet: 83.6% (+3.7% YOY)
- Rural population using internet: 47.9% (+2.8% YOY)
Most visited websites
Google is the most visited website in the world, receiving 101.35 billion visits per month, and YouTube is the most searched thing on Google, with an average monthly search volume of 151,000,000.
Facebook with 9.94 billion visits, Instagram with 5.71 billion visits, and ChatGPT with 5.24 billion visits. Other top sites include Wikipedia (5.07 billion), Reddit (4.51 billion), X (3.88 billion), WhatsApp (3.02 billion), and Bing (2.96 billion) in monthly traffic.
Interesting Read: Traditional search engines are no longer the only source of website traffic. AI is reshaping the search landscape. Discover which domains are most cited in ChatGPT. Check it out now!
Source: Exploding Topics, Siteefy, Data Reportal
Website Traffic Statistics
Most web traffic comes from mobile (58%) and organic search (53%), with Asia-Pacific on top, led by India and China, which account for 41.6% of visits.
Traffic by Source
More than half of all trackable website visits (53%) come from organic search, making it the biggest traffic source. It outperforms direct, paid, and social channels by a huge margin.
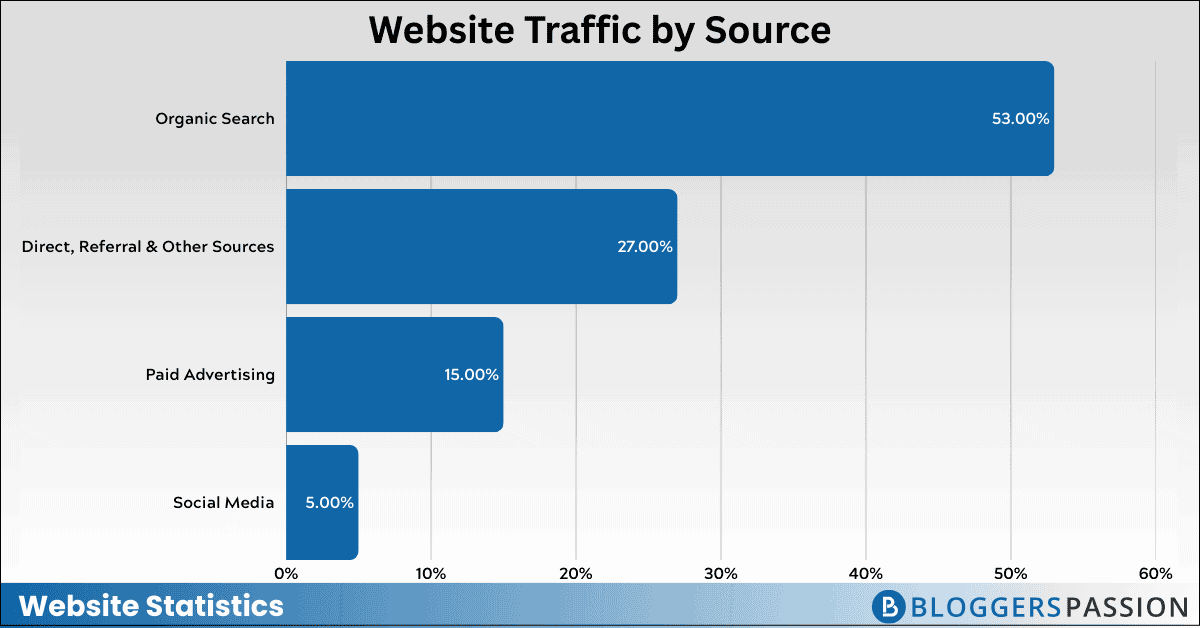
Here’s the table showing the traffic distribution across different sources based on the BrightEdge study.
| Source of Traffic | Share of Traffic (%) |
| Organic Search | 53% |
| Direct, Referral & Other Sources | 27% |
| Paid Advertising | 15% |
| Social Media | 5% |
Check out Bing statistics to learn about Microsoft’s search engine and its growing market share.
Traffic by Device
Mobile clearly dominates web traffic worldwide (~58%), followed by desktop, while tablets contribute only a very small share.
Here’s the table showing the distribution of website traffic by device type. (StatCounter)
| Device | Market Share (%) |
| Mobile | 58.39% |
| Desktop | 40.04% |
| Tablet | 1.57% |
Most voice search answers come from the top 3 Google results, with pages loading 52% faster and averaging 2,312 words. (Backlinko)
Here’s a table showing the growth of voice search in SEO.
| Voice Search Insight | Key Stat |
| Answers from top results | 80%+ come from the top 3 search results |
| Importance in SEO | 22.8% of SEO pros see it as most significant |
| Source of answers | All devices pull answers from SERP features |
| Page speed | Voice search pages load 52% faster |
| Content length | Avg. 2,312 words per ranking page |
Explore voice search statistics to see how smart assistants are changing the way people search online.
Traffic by Geography
Asia-Pacific drives the most web traffic worldwide, with India and China on top, making up 41.6% of all visits. (SQ Magazine)
Here’s the table showing traffic share by region.
| Region | Share of Traffic |
| Asia-Pacific | 41.6% |
| North America | 33.1% |
| Europe | 18.4% |
| Africa | 4.8% |
| Brazil | 52.7% |
Here are some of the countries/regions with key website traffic insights.
| Region / Country | Key Insight |
| South Korea | Highest average page views per session: 5.1 pages |
| Japan | Second-highest page views per session: 4.9 pages |
| Middle East (UAE, Saudi Arabia) | +13.7% increase in mobile-driven web traffic |
| United States | 66% domestic traffic, 34% international |
| Europe (Germany, UK, France) | Together, they account for 65% of Europe’s total web usage |
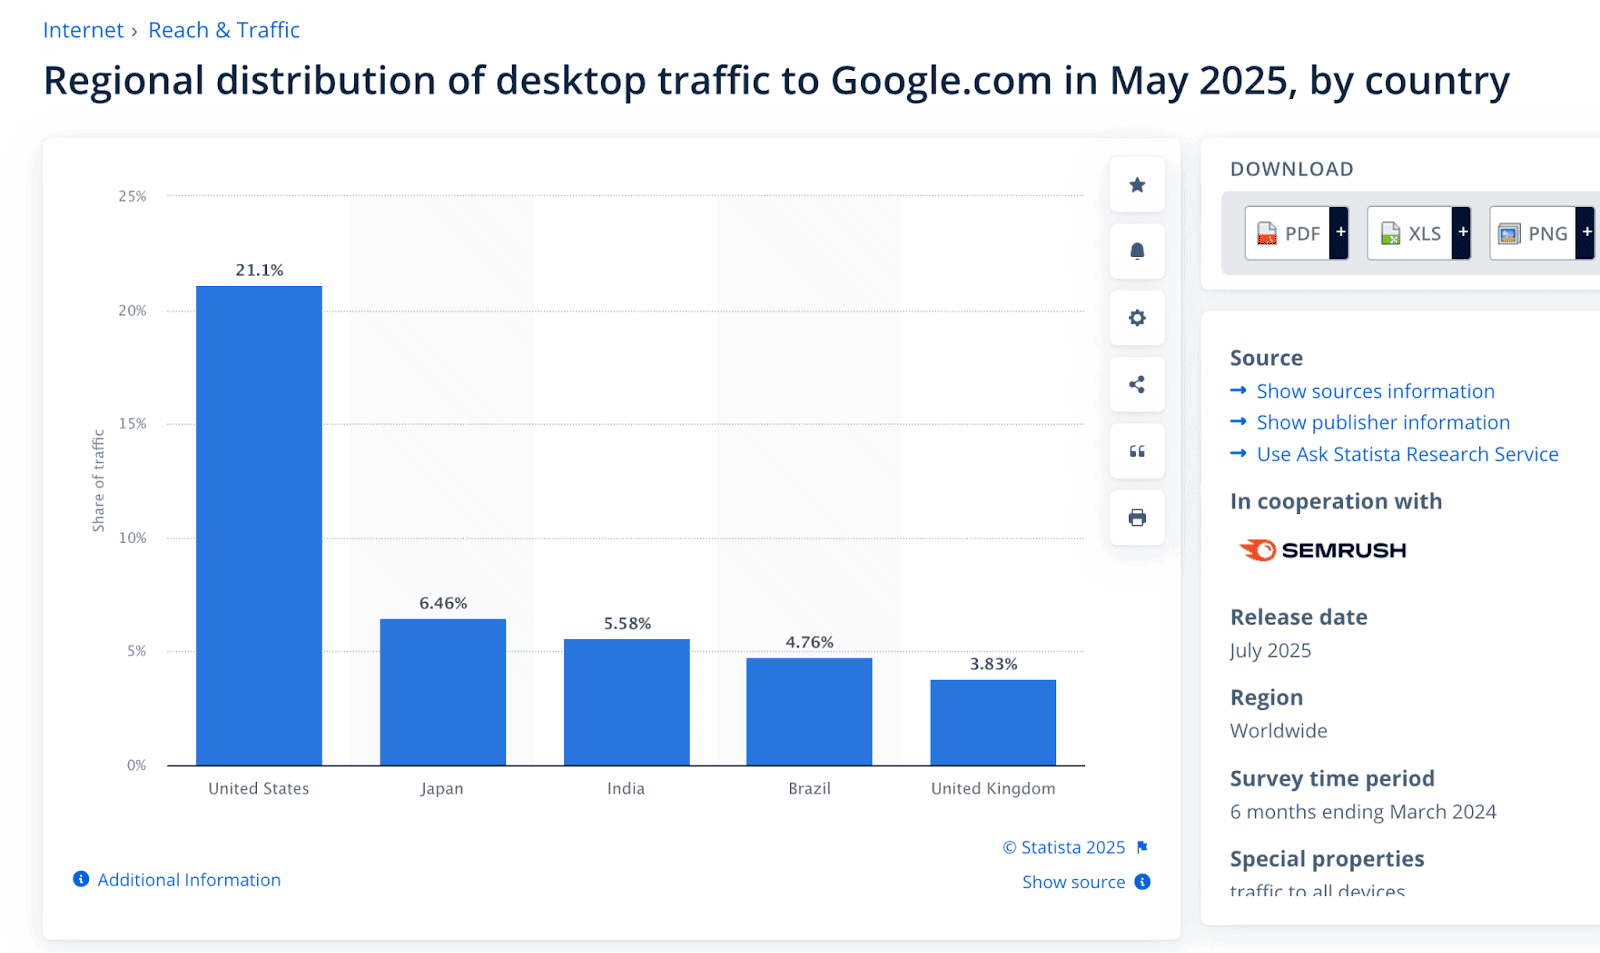
Country-Level Traffic to Google
As of today, most visits to Google.com originated from the United States (21.1%), followed by Japan (6.46%), Brazil (5.58%), and India (4.76%), indicating that a few key countries generate the largest share of Google’s global traffic. (Statista)
Website SEO and Ranking Statistics
Google dominates the search market with a nearly 90% market share, and most clicks go to the top three results or featured snippets. Yet, over 96% of pages get no traffic, and only a small fraction rank in the top 10 within a year.
According to Search Engines Market Share, Google holds the largest search engine market share globally, at 90.06%.

Here’s the year-on-year search engine market share of the major search engines since 2020.
| Year | Bing | Yandex | Yahoo! | Baidu | DuckDuckGo | |
| 2020 | 92.51% | 2.45% | 0.38% | 1.64% | 1.1% | 0.44% |
| 2021 | 91.86% | 2.71% | 0.87% | 1.46% | 1.13% | 0.66% |
| 2022 | 91.9% | 2.88% | 1.28% | 1.51% | 1.14% | 0.69% |
| 2023 | 92.9% | 3.03% | 0.85% | 1.21% | 0.65% | 0.58% |
| 2024 | 91.47% | 3.43% | 1.78% | 1.1% | 0.83% | 0.54% |
| 2025 | 90.06% | 4.31% | 1.84% | 1.45% | 0.72% | 0.95% |
Ranking and Click-Through Rates
Most clicks go to the top 3 organic results. (FirstPageSage)
The table below shows the average CTR for standard organic and paid Google Search results.
| Google Search Spot | Avg. Click Share (CTR) |
| Ad – Top (1st) | ~2.1% |
| Ad – 2nd | ~1.4% |
| Ad – 3rd | ~1.3% |
| Ad – 4th | ~1.1% |
| Organic Result – #1 | ~39.8% |
| Organic Result – #2 | ~18.7% |
| Organic Result – #3 | ~10.2% |
| Organic Result – #4 | ~7.2% |
| Organic Result – #5 | ~5.1% |
| Organic Result – #6 | ~4.4% |
Here are a few more interesting Google CTR stats for 2026;
- When a snippet or AI overview appears: 38.9%–42.9%
- When a local pack is present: 23.7%
- When a snippet or AI overview appears: 27.4%–29.5%
- When a local pack is present: 15.1%
Extra Read: Ever wondered why Gmail is a must-use tool for every website owner? Find out in the detailed Gmail Stats.
SEO Optimization
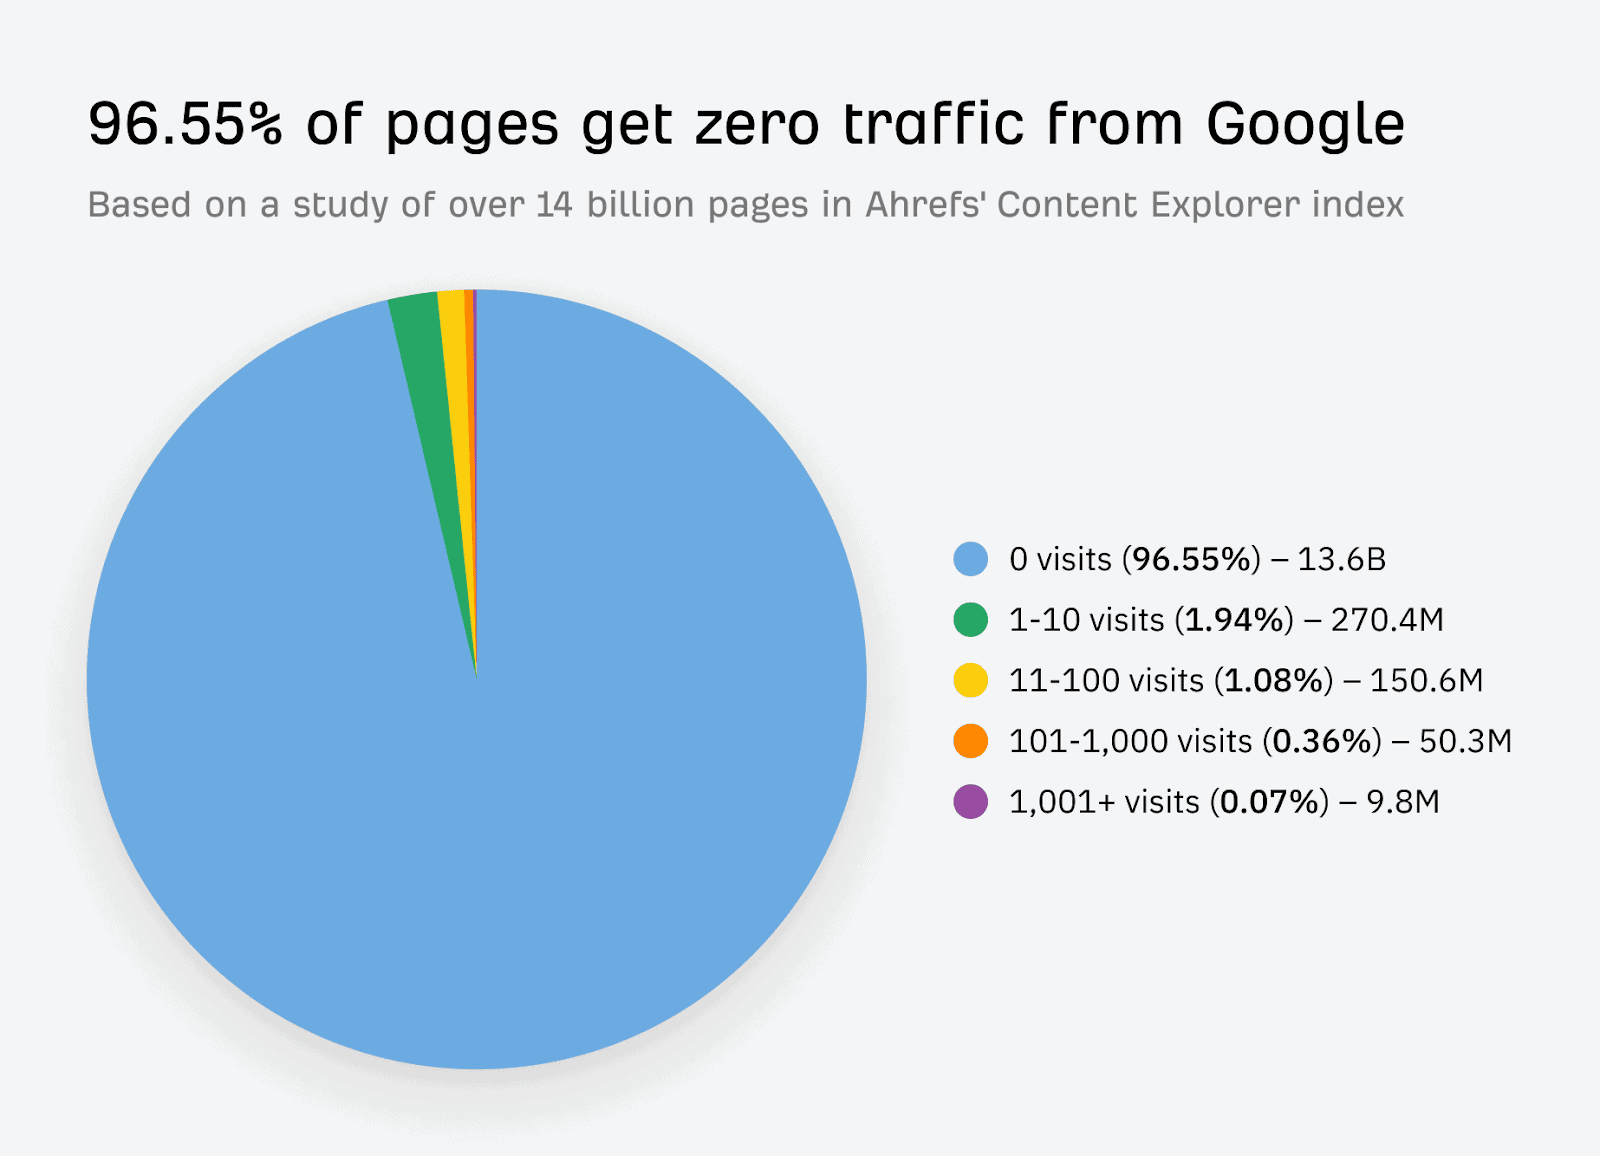
96.55% of all pages get no traffic from Google. Only 1.94% manage between 1 and 10 visits per month. (Ahrefs)
The reasons for zero traffic include;
- According to Link Building Statistics, 0.63% of pages receive zero traffic from Google searches because they have no backlinks at all.
- Publishing topics that have no demand
- The content doesn’t match search intent
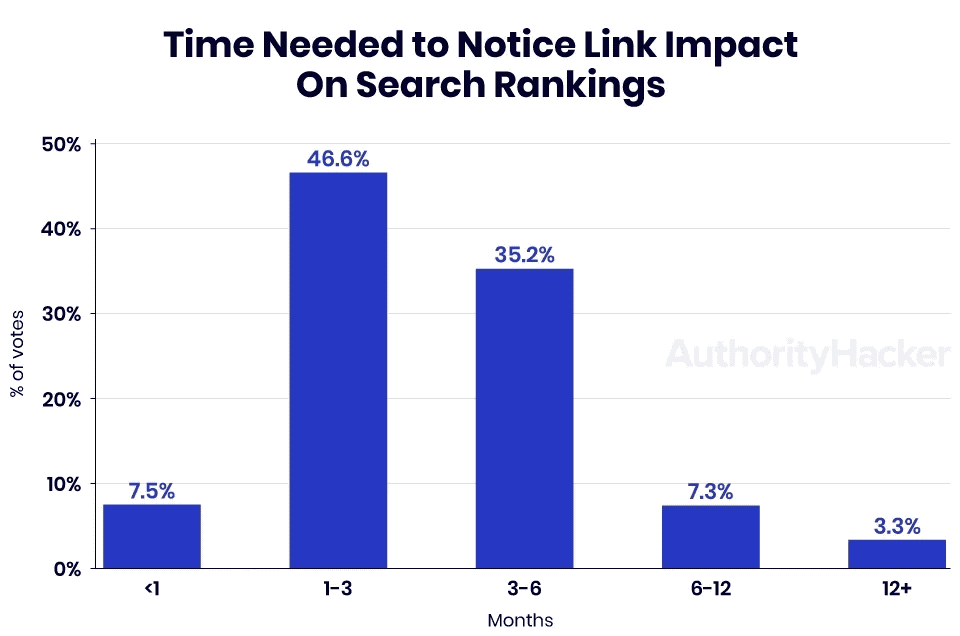
It typically takes around 3 months for a backlink to impact search rankings positively. It rarely happens in less than a month or more than 6 months.
58% of businesses still ignore local SEO. About 31% want to start, but only 30% actually have a plan to optimize for local search.
How long does it take for a page to rank in Google?
Most new pages don’t rank quickly. Within a year, only about 6% reach the top 10 results, while nearly 75% never even make it to the top 100.
Pages from strong domains (high DR) perform better, with approximately 10.8% reaching the top 10, compared to weak domains (low DR), where only 3% manage to do so.
Discover the latest Google search statistics to see how people use the world’s most popular search engine.
Website Security Statistics
HTTPS is now used by 88.3% of websites. Cyber threats remain high, with 600 million attacks daily, 6.5 billion malware cases in 2025, and ransomware accounting for 68% of all threats. Businesses also face 5 hours of downtime monthly.
HTTPS Adoption in Websites
The default protocol HTTPS is used by 88.3% of all websites. (W3Techs)
In fact, the use of HTTPS as the default protocol has steadily grown over the past year, moving from 86% in August 2024 to 88.3% by August 25, 2025.
Here’s the HTTPS adoption over the last few months.
| Date | HTTPS Usage (%) |
| Aug, 2025 | 88.3% |
| Jun, 2025 | 88% |
| Mar, 2025 | 87.3% |
| Jan, 2025 | 87.7% |
| Nov, 2024 | 86.7% |
| Aug, 2024 | 86.0% |
Using HTTPS is extremely important for both SEO and trust. Basically, HTTPS transmits all data in an encrypted form.
To enable HTTPS on your domain or website, you need to install an SSL certificate.
Most cloud web hosting providers offer free SSL certificates (that enable HTTPS by default).
Cybersecurity Threats
Microsoft reports that approximately 600 million cyberattacks occur daily. In 2025, over 3,200 data breaches exposed 1.7 billion people, which is almost 54 every second. (Exploding Topics)
Ransomware is the most significant cyber threat, accounting for 68% of all detected attacks. This means almost 7 out of 10 threats today are ransomware. (CheckPoint)
Manufacturing was hit the most by ransomware in 2024 (29%). Attacks also grew fast in transport (+40%) and government (+31%), while retail (-34%) and software (-57%) saw big drops.
Get the latest SEO statistics to understand ranking factors and how websites gain traffic.
Here’s the breakdown of ransomware attacks in various industries.
| Industry | Share of Ransomware Attacks | Change vs Last Year |
| Manufacturing | 29% | +56% |
| Healthcare | 11% | +27% |
| Finance/Banking | 7% | -8% |
| Education/Research | 6% | -3% |
| Government/Military | 6% | +31% |
| Insurance/Legal | 5% | -25% |
In 2025, there were over 6.5 billion malware attacks worldwide, up 8% from last year. The worst year in the past decade was 2018, with 10.5 billion attacks.

Here’s a breakdown of the number of malware attacks worldwide;
| Year | Number of Malware Attacks |
| 2025 | 7 billion* |
| 2024 | 6.54 billion |
| 2023 | 6.06 billion |
| 2022 | 5.5 billion |
| 2021 | 5.4 billion |
| 2020 | 5.6 billion |
Downtime and Data Breaches
Businesses face around 5 hours of downtime each month, while data breaches cost $4.4 million globally and $10.22 million in the U.S.
Website downtime insights
Businesses face about 5 hours of downtime each month, mostly affecting marketing (61%), IT (56%), and services (52%). (ITPro)
1 in 5 businesses loses over $2,500 per month, while fixing problems costs approximately $418 per month on average.
Cost of data breaches
The global average cost of a data breach is $4.4 million, down 9% from last year, thanks to faster detection and control.
In the U.S., the cost is much higher at $10.22 million, which is almost double the global average. (IBM Security)
How Many Websites are in eCommerce
There are currently over 30-31 million eCommerce sites. Luxury and jewelry face an 82.8% cart abandonment rate, while food and beverage have the best conversion rate at 6.1%. Among platforms, Shopify leads with 25% of all sites.
eCommerce Growth
As of 2026, there are about 30-31 million active ecommerce websites worldwide, and the number keeps growing every year. By 2028, sales are expected to reach $7.89 trillion, with eCommerce capturing 22.5% of the retail market.
eCommerce Revenue Stats
According to eMarketer, worldwide eCommerce sales are projected to continue growing from $6.41 trillion in 2026 to $7.89 trillion in 2028.
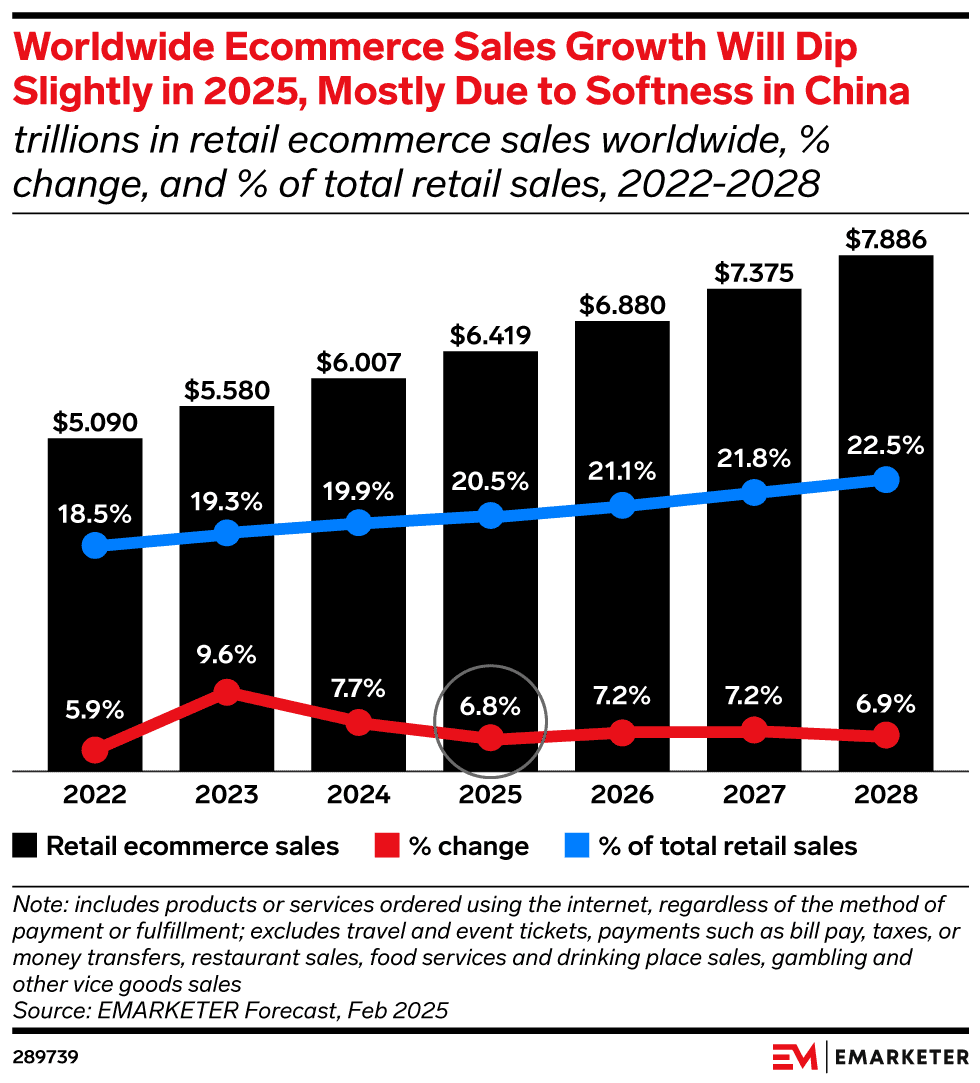
Here are some interesting eCommerce revenue stats from the eMarketer study;
- eCommerce accounted for 19.9% of total retail sales in 2025 and is expected to rise to 22.5% by 2028.
- The fastest growth happened in 2023 (+9.6%).
- Growth is expected to slow slightly in 2026 (+6.8%), primarily due to weaker sales in China. After 2026, growth is expected to remain steady at around 7% per year.
eCommerce Conversions and Cart Abandonment Rates
The food and beverage industry sees one of the highest eCommerce conversion rates, averaging around 6.1%.
Here’s a quick comparison table of conversion rates by industry. (Oberlo)
| Industry | Average ecommerce conversion rate |
| Food & beverage | ~ 6.1% |
| Multi-brand retail | ~ 4.9% |
| Beauty & personal care | ~ 4.5% |
| Fashion, Accessories & Apparel | ~ 3% |
| Consumer Goods | ~ 3% |
| Pet Care & Veterinary | ~ 2.5% |
| Home & Furniture | ~ 1.2% |
| Luxury & Jewelry | ~ 1.2% |
The luxury and jewelry industry has a very high cart abandonment rate of about 82.8%. It is likely due to browsing expensive items, but hesitating to complete the purchase because of the high prices.
Here’s a quick comparison table of cart abandonment rates by industry. (Oberlo)
| Industry | Average cart abandonment rate |
| Luxury & jewelry | 82.84% |
| Beauty & personal care | 80.92% |
| Home & furniture | 80.32% |
| Fashion, accessories, and apparel | 78.53% |
| Food & beverage | 63.62% |
eCommerce Platforms
Shopify is the most widely used eCommerce platform, with 25% of sites.
Here’s a comparison of popular eCommerce platforms.
| Platform | Usage Share |
| Shopify | 25% |
| WooCommerce Checkout | 13% |
| Shopify Plus | 9% |
| Magento | 7% |
| PrestaShop | 3% |
| Others | 43% |
Source: BuiltWith
Blogging and Content Website Stats
There are over 1.4 billion sites online and 700 million blogs, with most posts averaging around 1,400 words. Bloggers who post frequently tend to generate more traffic, and approximately one in three make money, primarily from affiliate marketing, ads, and sponsored posts.
Blog Growth and Usage
There are over 6 million posts published daily and 70 million monthly on WordPress alone. Approximately 207 million people blog worldwide, mostly aged 25–34, and most post content weekly.
Total number of blogs
There are over 700 million blogs among the 1.4 billion websites worldwide, meaning more than one-third of all websites are blogs. Tumblr alone hosts the largest share, with around 621 million blogs. (Tumblr)
Every day, people publish over 6 million blog posts online, totaling approximately 2.5 billion posts per year. On WordPress alone, around 70 million new blog posts go live each month.
Curious about the latest blogging growth numbers? Check out this comprehensive list of blogging statistics to get an idea of the industry in 2026.
Total number of bloggers
There are approximately 207 million content creators worldwide, comprising 200 million active users and over 2 million experts. (LinkTree Report)
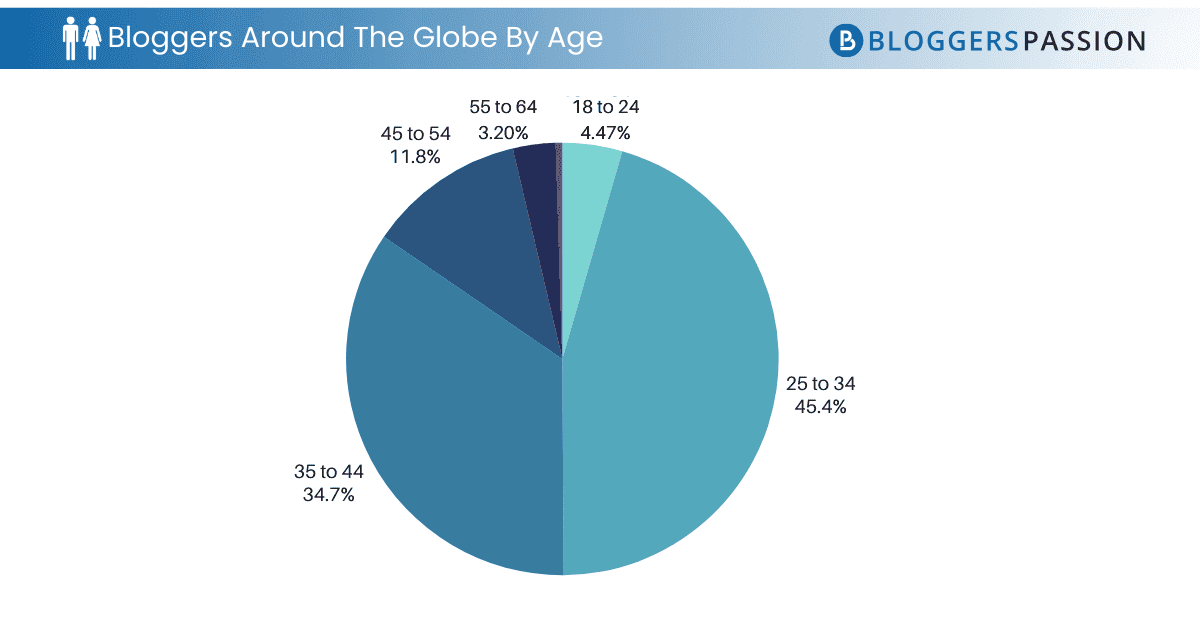
Most bloggers worldwide are in the 25–34 age group with a share of 45.4%.
Blog post publishing frequency
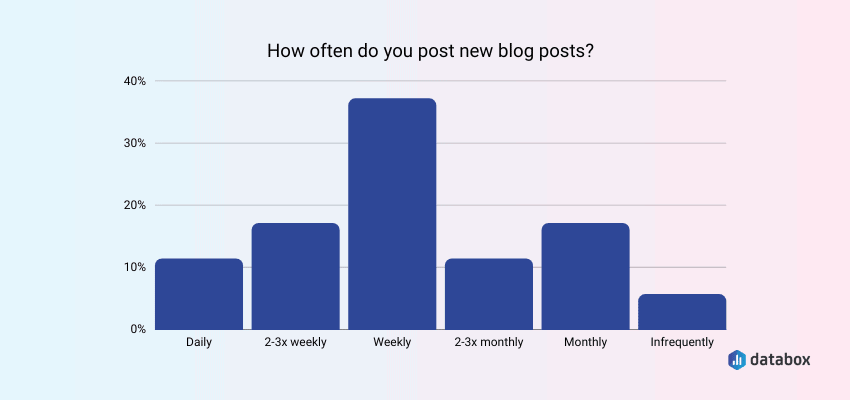
Most bloggers publish new posts weekly (about 37%), while around 17% post either 2–3 times a week or monthly. About 11% publish daily, and another 11% post 2–3 times a month, while only around 5% blog infrequently.
Popular CMS platforms
WordPress leads the CMS market by a wide margin, powering about 61% of all websites that use a content management system.
Shopify (6.8%) and Wix (5.6%) come next, while Squarespace (3.4%) and Joomla (2.0%) hold smaller shares. Other platforms, such as Webflow, Drupal, Tilda, Adobe Systems, Duda, and GoDaddy Website Builder, each account for around 1% or less. (W3Techs)
See important WordPress statistics that highlight why it powers most of the world’s websites.
Blog Engagement
Blogs now average around 1,400 words, and posts between 1,000–2,000 words get the most shares, while publishing 16+ posts a month can bring 3.5× more traffic.
Traffic & Reach
Websites that published 16 or more blog posts each month got almost 3.5 times more traffic than websites that posted only 0 to 4 times a month. (HubSpot)
On average, pages that rank in Google’s top 10 have about 1,447 words. This shows that longer content often performs better in search results. (Backlinko)
Stay updated with content marketing statistics that reveal what works best for reaching and engaging your target audience.
Social share trends
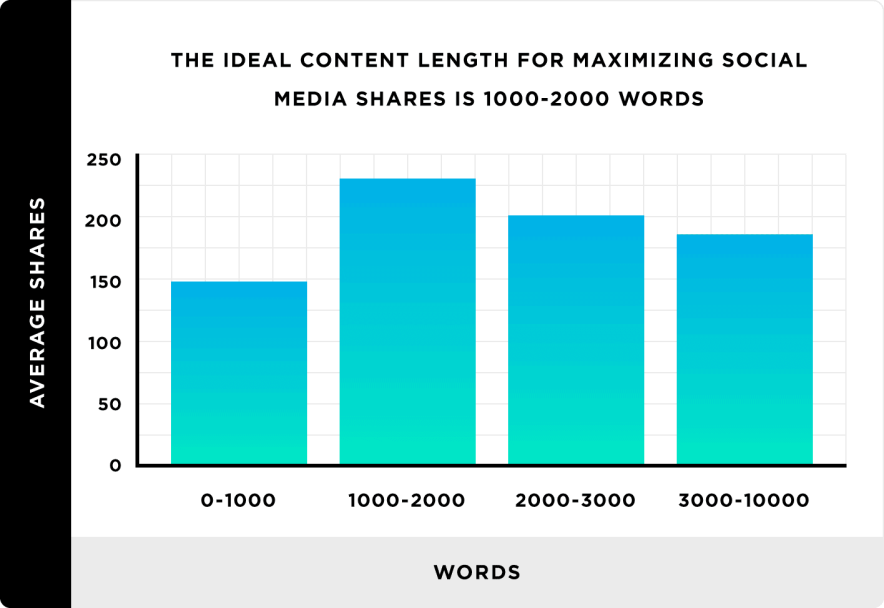
Articles with 1,000–2,000 words get the most social shares, averaging about 235 shares, which is 56% more than short posts under 1,000 words (about 150 shares). (Backlinko)
Content length trends
The average blog post length has increased significantly over the years. In 2014, it was approximately 800 words, but by 2021, it had expanded to over 1400 words.
Since then, the blog’s length has remained relatively constant, with posts in 2023 averaging approximately 1,427 words and in 2024, about 1,394 words. (Orbit Media)
What are the top challenges for most website owners?
Getting traffic from SEO is the biggest challenge for 53% of website owners. (Orbit Media)
It is followed by;
- User engagement
- Social media traffic
- Getting traffic from email marketing
Blog Monetization
Approximately 1 in 3 bloggers earns money from blogging, primarily through affiliate marketing, sponsored posts, and advertisements. Around 10% earn over $10,000 a year, while only a few use courses, books, or membership sites to earn.
How many blogs earn money?
Approximately one in three bloggers earns money from their blogs, and around 10% earn over $10,000 per year. A tiny group (0.6%) makes more than $1 million each year. (WebTribunal)
Popular website monetization models
Most bloggers generate income through affiliate marketing (70%), which is the primary source of revenue. (Finances Online)
Affiliate marketing is followed by;
- Sponsored posts with 57% of bloggers using it
- Nearly half (49%) use pay-per-click ads
- Freelancing or consulting is chosen by 35% of bloggers
- Selling courses (25%)
- Selling books and printables (23%)
Membership sites are less popular, with only 6% of bloggers using them as an income stream.
Affiliate and social media marketers report that adding a CTA within videos can increase clicks by over 380%. Check out the full CTA Statistics for more insights.
Conclusion
eCommerce has grown to over 30 million websites and is worth trillions, with global B2B eCommerce alone valued at about $32 trillion.
Most people browse the web on mobile (58%), and Google is the primary search engine that billions use daily.
For most businesses and marketers, stats help you understand what channels are driving the best results. For bloggers, stats reveal what kind of posts readers enjoy most, how long they stay on your site, and what leads to cart abandonments.
What are your thoughts on the website stats listed here? Have any more questions? Let us know in the comments.
FAQs
Here are some quick answers to common questions about the latest stats on the number of websites, growth trends, and usage insights in 2026.
There are over 1.4 billion websites today, but only about 15% are active. Each day, more than 252,000 new sites go live, and over half of all web content is in English.
A staggering 58.39% of all global web traffic comes from mobile devices.
eCommerce, news, social media, and entertainment websites attract the most visitors worldwide.
The average bounce rate typically ranges from 26% to 40%, according to HubSpot.
China leads in total internet users, with 1.11 billion out of 1.416 billion people (approximately 78%), followed by India with 806 million users out of 1.464 billion (approximately 55%).