

The digital marketing world is exploding worldwide, with the market size of $1.3 trillion by 2033.
You’re in the right place if you’re looking for up-to-date, interesting digital marketing statistics for 2026.
Did you know that Google searches for “digital marketing” have grown exponentially over the last few years?
The report from Google Trends shows that digital marketing growth is greater than ever worldwide.
So let’s find out a few more amazing digital marketing ROI statistics.
30+ Bite-Sized Digital Marketing Statistics for 2026
As of 2026, the U.S. digital advertising and marketing market is estimated to be worth around $460 billion. Let’s get dive into one by one digital marketing stats:
Email Marketing Statistics
Email marketing is a KEY part of digital marketing. Here are some of the bite-sized statistics around email marketing for 2026.
1. What is the ROI of emails?
Email marketing has a return on investment (ROI) of $10 to $36 for every $1 spent (Source: Litmus)
The ROI of email marketing is usually high because the people who interact with your emails are already interested in the products or services you offer. Also, the ROI changes according to the industry.
Here’s a quick breakdown of the ROI by industry:
- Retail, ecommerce, & consumer goods: 45:1
- Marketing, PR, & advertising agency: 42:1
- Software & technology: 36:1
- Media, publishing, events, sports, & entertainment: 32:1
2. What is the average click-through rate in email marketing?
The average CTR in email marketing is 2.3%, and Sectors such as Education, Agriculture, and Financial Services tend to see the strongest email engagement, with open rates often landing in the mid-20% range.
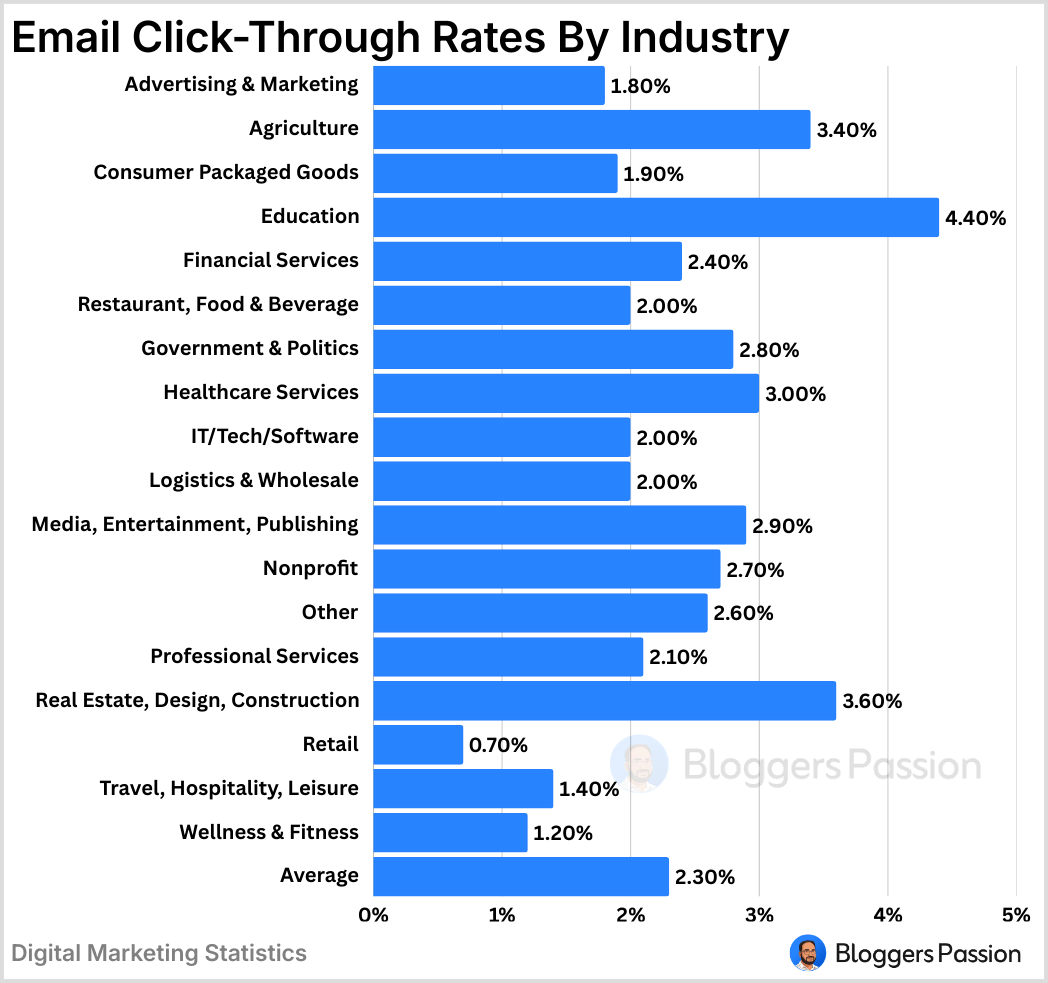
Here’s a quick industry-wise breakdown of the average CTR of email marketing.
| Industry | Click-Through Rates |
|---|---|
| Advertising & Marketing | 1.8% |
| Agriculture, Forestry, Fishing, Hunting | 3.4% |
| Consumer Packaged Goods | 1.9% |
| Education | 4.4% |
| Financial Services | 2.4% |
| Restaurant, Food & Beverage | 2.0% |
| Government & Politics | 2.8% |
| Healthcare Services | 3.0% |
| IT/Tech/Software | 2.0% |
| Logistics & Wholesale | 2.0% |
| Media, Entertainment, Publishing | 2.9% |
| Nonprofit | 2.7% |
| Other | 2.6% |
| Professional Services | 2.1% |
| Real Estate, Design, Construction | 3.6% |
| Retail | 0.7% |
| Travel, Hospitality, Leisure | 1.4% |
| Wellness & Fitness | 1.2% |
| Average | 2.3% |
Source: Campaign Monitor
According to CTA Stats, Social media ads with clear CTAs get 285% more clicks than average.
3. Do marketers use email segmentation?
Nearly 26% of marketers surveyed use audience segmentation tactics to improve email engagement. (Source: HubSpot)
4. How many email users are there?
According to Statista, as of 2026, there are over 4.7 billion email users worldwide.
5. How many emails are sent every second?
As of 2026, an estimated 347.3 billion emails are sent each day worldwide, and by the end of the year, the number is expected to reach 392.5 billion. (Venngage)

6. Does adding a video to an email help?
Yes, adding a video to your email can increase your open rate by up to 13%. That’s because most email readers prefer watching a video to reading text. Also, businesses that send out video emails are less likely to lose their email subscribers. (Business News Daily)
7. How often do marketers send emails?
45% of marketers send weekly emails. Also, over 40% of marketers said that sending marketing emails on a Tuesday proved best for better engagement. (Databox)

8. What day of the week is best for email marketing?
Fridays have the highest email open rates (approximately 19%) worldwide, compared to Saturdays, which have the lowest (17%).
However, the highest open rate of emails is on Monday. (Source: Campaign Monitor)

9. What are the effective strategies for email marketing?
The most effective strategies for email marketing campaigns are subscriber segmentation (78%), message personalization (72%), and email automation campaigns (71%). (HubSpot Blog Research)
10. How much is email marketing worth?
Email marketing revenue is estimated to reach almost 17.9 billion by 2027. The compound annual growth rate (CAGR) for that period is expected to be 13.3 percent. (Source: Statista)
eCommerce Statistics
Looking for the latest eCommerce stats worldwide? Here’s a handpicked list for you.
1. What are retail eCommerce sales globally?
Global B2B ecommerce revenue is expected to grow to $36 trillion by 2026. Heavy industries like advanced manufacturing, energy, healthcare, and professional business services make up most of this B2B sales value. (International Trade Administration)

2. How many eCommerce websites are there?
There are over 30 million eCommerce websites worldwide, and the number is growing due to digitalization.
The growth of eCommerce websites is increasing because of easy-to-use store-building platforms like Shopify. Shopify powers more than 1 million online stores, and Shopify’s market cap is $94.81 billion. That’s how big Shopify is.
3. What percentage of purchases are made online?
Nasdaq predicts more than 95% of all purchases will be done through eCommerce by 2040.
4. Which country is the global eCommerce market leader?
China is the leading global ecommerce market, accounting for a whopping 46.3% of all retail ecommerce sales worldwide. The Chinese eCommerce market’s total online sales were over $2.8 trillion in the last year.
Bonus Read: Dive into web hosting stats to see how the industry is booming, with revenue set to reach $159.9 billion in 2026!
5. Which payment system is mostly used in eCommerce?
By 2026, digital wallets (54%), credit cards (16%), and debit cards (10%) are expected to be the most commonly used eCommerce payment methods worldwide. (Source: Statista)
Mobile Commerce Statistics
Looking for the latest mobile commerce statistics? Here’s the updated list for 2026.
1. How much is spent on mobile advertising?
The mobile advertising market was valued at $322.67 billion in 2026. (Fortune Business Insights)
| Year | Market Size (USD Billion) | Notes |
|---|---|---|
| 2025 | 262.84 | Market valuation |
| 2026 | 322.67 | Estimated size |
| 2032 | 142.68 (U.S. only) | Projected U.S. market value |
| 2034 | 1,266.57 | Forecasted global market size |
If you’re running an agency or an online store, make sure to keep mobile users in mind. Optimize your product pages and products for mobile, as mobile purchases are growing exponentially.
2. Do people read emails on mobile or desktop?
23% of consumers who open an email on a mobile device will open that email again later, many times on a desktop. (Campaign Monitor)
3. Which industry spends the most on mobile ads?
The retail industry is the biggest spender on mobile ads. The second-biggest mobile ad spender is the Consumer Packaged Goods (CPG) industry, with $21.8 billion spent last year. (Oberlo)
According to Think With Google, paid YouTube mobile ads are 84% more likely to attract viewers’ attention than TV advertising.
4. How many people check emails daily?
According to the ZeroBounce Email Statistics Report, the vast majority of people (93%) look at their inbox every day
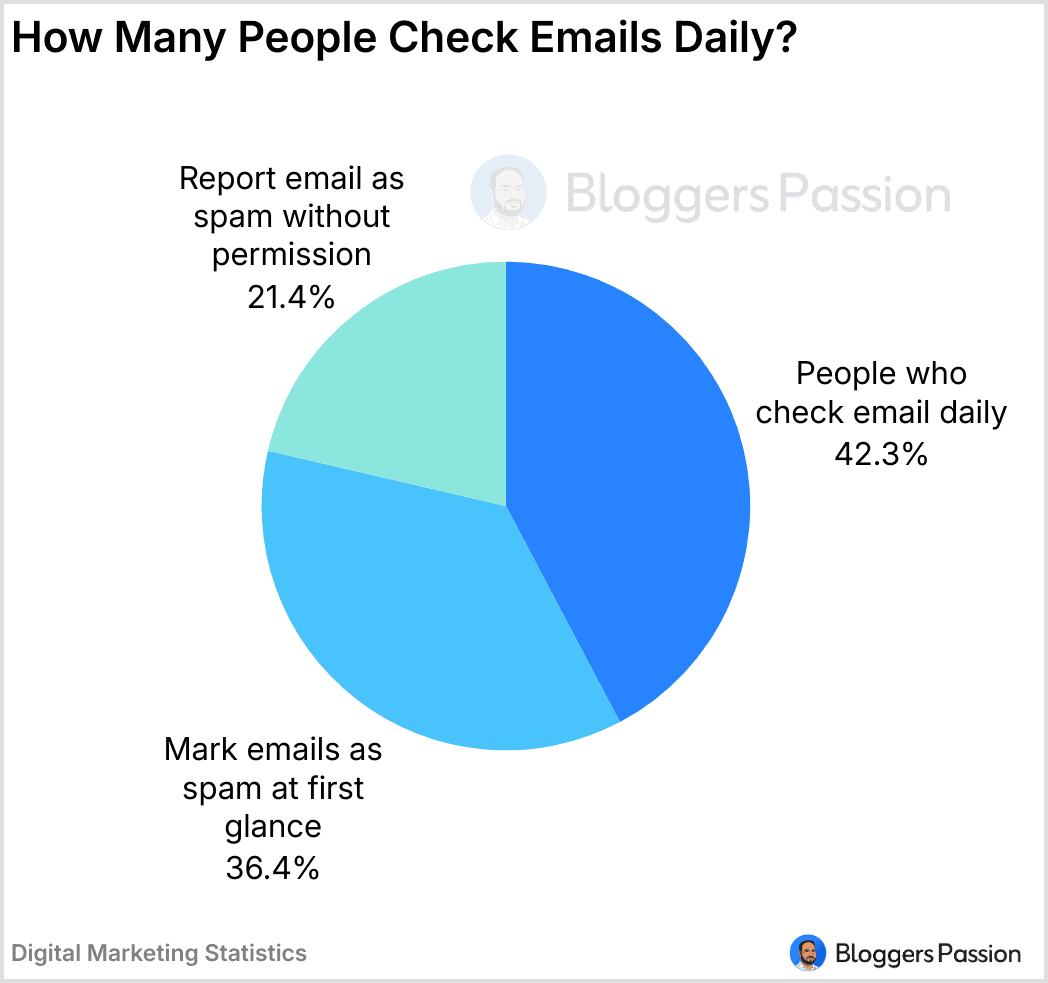
- 80% mark emails as spam based on appearance at first glance.
- 41% check email specifically for brand discounts.
- 46% open emails from brands that send relevant messages consistently.
5. Is the average order value higher on mobile or desktop?
The average value of U.S. online shopping orders is generally higher on desktops than on mobile devices. But the frequency of mobile purchases is higher than that of desktop purchases. (Source: Statista)
The takeaway here is that although the overall order value is lower on smartphones, the overall quantity is higher compared to desktop purchases.
Bonus Read: Discover how digital marketers use Gmail for marketing and get detailed insights with our Gmail statistics.
Search Engine Optimization Statistics
Looking for exciting SEO stats for 2026? This section is just for you.
1. How much is the SEO industry worth?
The global SEO software market is expected to grow to $265.91 billion by 2034. (Precedence Research)
2. How many searches on Google per day?
Google processes nearly 158,548 searches every second, that’s 14 billion daily and over 5 trillion each year! (Source: Internet Live Stats).
3. What is the close rate of SEO leads?
SEO leads have a whopping 14.6% close rate, while outbound leads, such as direct mail or print advertising, only have a 1.7% close rate. (Source: HubSpot)
SEO can be your best bet if you plan to increase your product sales with a higher close rate. It works way better than other expensive offline channels such as print ads, direct mail, etc.
Did you know that 76% of marketers use webinars to generate more leads? For more interesting facts, check out my webinar statistics.
4. How much do companies spend on SEO?
Most companies spend $500 to $5,000 per month on SEO. On average, agencies charge $3,209 per month, while freelancers charge about $1,348 per month.
Per-project SEO pricing often falls between $2,501 and $5,000. This is the most common range, charged by 21.2% of respondents. (Ahrefs)

5. What percentage of traffic is mobile?
Over 63% of website traffic comes from mobile devices. 92.3% of internet users access the internet using a mobile phone. (Source: Exploding Topics)

Statista also reports that global website traffic from mobile devices has consistently hovered around 50% since 2017.
If you run an online store or website, make sure to create a mobile-friendly design, as smartphone usage continues to grow.
Understand how Semrush’s user growth from 388,000 to 1.1 million aligns with evolving digital marketing trends. Check out the Semrush Statistics for a closer look.
Social Media Statistics
Here are some fascinating social media stats to know as a marketer.
1. How many people use social media to buy products?
Over 55% of social media users in the US aged 18 to 24 made at least one purchase through social channels, followed by users aged 25-34 years old. (Statista)
2. What are the global sales made through social media?
Global sales through social media platforms were estimated at $1.263 trillion U.S. dollars last year. Statista predicts that the value of social commerce sales will reach around 2.9 trillion U.S. dollars by 2026.
3. Does Facebook have billions of users?
Facebook has over 3.068 billion monthly active users as of the last quarter of 2024! (Social Shepherd)
See the latest numbers and growth trends in SaaS statistics for 2026 to understand the impact of SaaS on modern companies.
4. What is X/Twitter’s growth rate?
As of 2026, X has 650 million monthly active users and over 245 million daily active users.
Among X users, 36.6% were aged 25–34, 34.2% fell in the 18–24 age group, and only 2.4% were aged 50 and above.

5. How many active users does Instagram have in 2026?
As of 2026, Instagram has more than 3 billion active monthly users.
6. How many daily active users are on YouTube?
YouTube’s exact daily active user count isn’t provided, but the platform has about 2.54 billion active users overall (monthly).
Final thoughts
Whether you’re running an online store, website, or business, you need digital marketing to grow.
Ever since the Pandemic, digital marketing has been growing rapidly. The reason behind digital marketing growth can be attributed to the number of smartphone users worldwide.
Did you like our exclusive list of digital marketing stats and facts? Do you have any questions? Let us know in the comments.
FAQs
Here are a few exciting questions about b2b digital marketing statistics.
The digital marketing market size globally is expected to reach over $1.3 trillion by 2033!
The global SEO market is estimated to be worth $99.4 billion by 2027.
Six out of every ten online purchases are now made on mobile devices! As of now, Mobile e-commerce has reached $2.52 trillion and is expected to reach $3.44 trillion by 2027.
According to Statista, digital advertising spending worldwide is expected to increase to $835.82 billion by 2026.
The global digital advertising market worldwide is expected to reach $786.2 billion by 2026.
Artificial intelligence, voice search, and short-form video content are emerging trends in digital marketing.


Leave a Comment
Your email address will not be published. Required fields are marked *