

Email marketing isn’t going anywhere in 2026; it’s bigger, smarter, and more profitable than ever. With 4.48 billion users worldwide and one of the highest returns of any marketing channel, email continues to drive traffic, leads, and sales for businesses of all sizes.
In this ultimate list of email marketing statistics, you’ll discover the latest data on users, ROI, open rates, conversions, and trends to help you understand what’s working right now and how to improve your campaigns.
Key Email Statistics at a Glance (2026)
- There are over 4.48 billion email users worldwide in 2026.
- Around 347 billion emails are sent every day globally.
- Email marketing delivers an average ROI of $36 for every $1 spent.
- The average email open rate is about 34.5% across industries.
- About 55% of emails are opened on mobile devices.
1. How many email users are there across the world?
There are currently over 4.48 billion email users worldwide. It is set to grow to 4.85 billion users in 2027. (Statista)
90% of Americans aged over 15 use email. 4 out of 5 marketers prefer email marketing over social media.
2. How many emails are sent every day?
About 347 billion emails are sent daily worldwide.
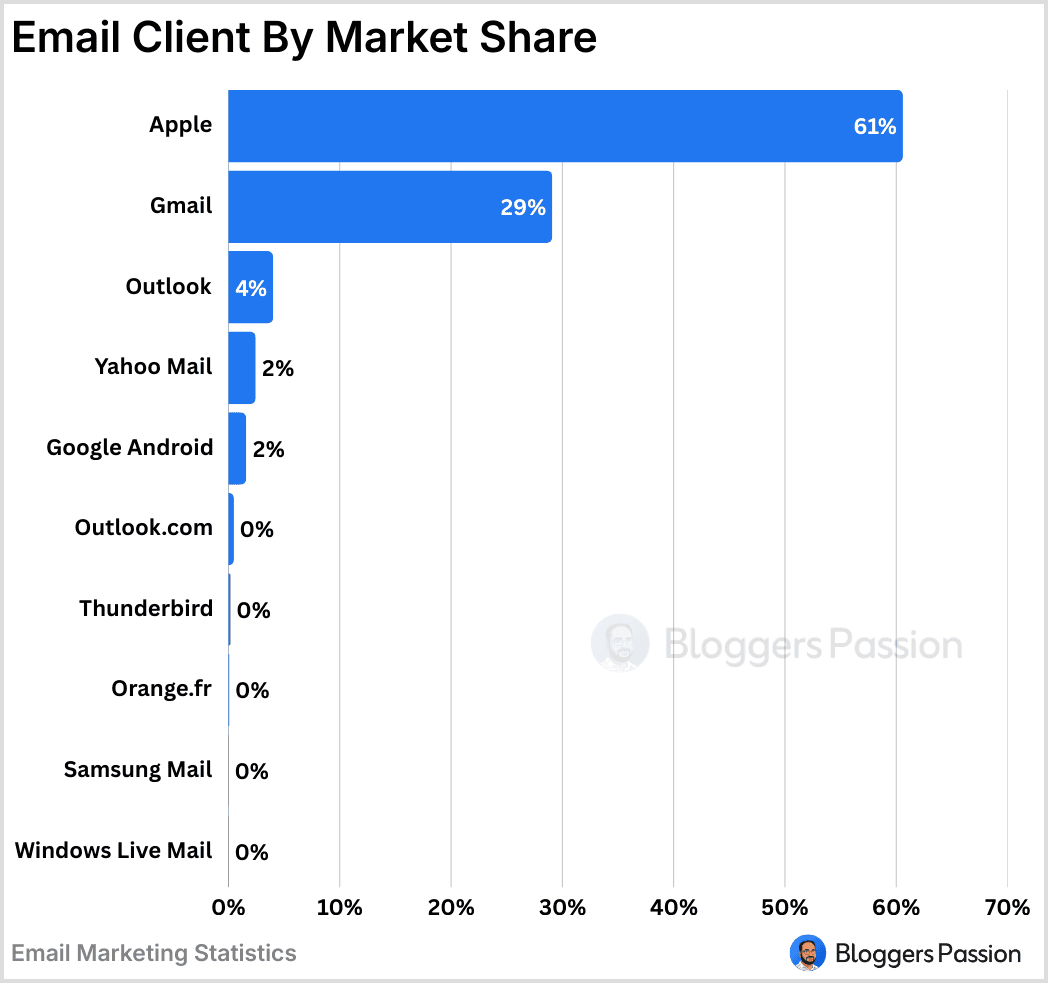
3. What is the most used email client in the world?
As of 2026, Apple holds the market share lead with 60.60%, followed by Gmail with a 29.10% share. Microsoft’s Outlook comes in third with a 4.02% market share.
| Email Client | Market Share (%) |
|---|---|
| Apple | 60.60% |
| Gmail | 29.10% |
| Outlook | 4.02% |
| Yahoo Mail | 2.45% |
| Google Android | 1.60% |
| Outlook.com | 0.49% |
| Thunderbird | 0.20% |
| Orange.fr | 0.09% |
| Samsung Mail | 0.03% |
| Windows Live Mail | 0.03% |
4. What is the average email deliverability rate?
The average email deliverability for all email service providers is 83-85%.
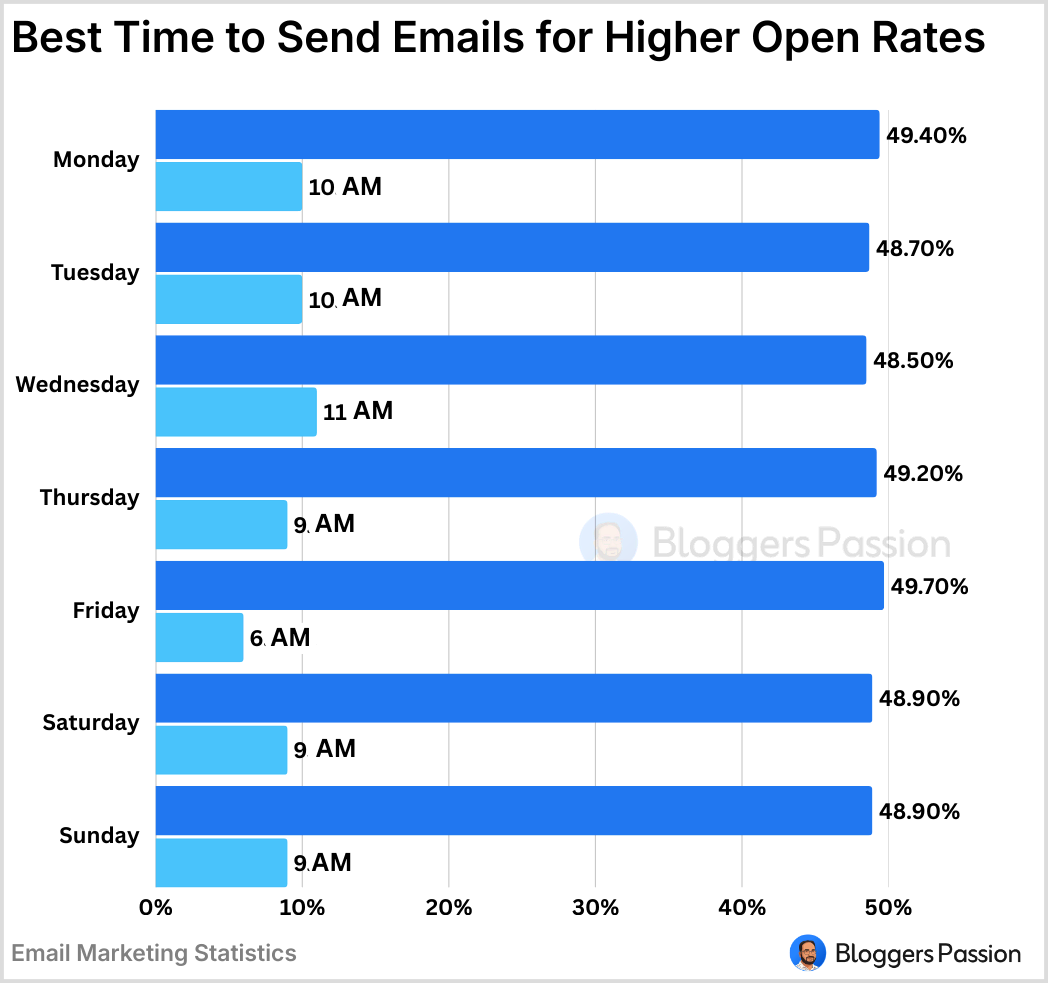
5. What is the best time to send emails to have better open rates?
Email campaigns perform best at 10 a.m., with average open rates around 49%, followed by 9 a.m. and 11 a.m., which also see strong engagement across most days of the week.
| Day | Best Time to Send | Average Open Rate |
|---|---|---|
| Monday | 10:00 AM | 49.40% |
| Tuesday | 10:00 AM | 48.70% |
| Wednesday | 11:00 AM | 48.50% |
| Thursday | 9:00 AM | 49.20% |
| Friday | 6:00 PM | 49.70% |
| Saturday | 9:00 AM | 48.90% |
| Sunday | 9:00 AM | 48.90% |
6. What percentage of emails are opened on mobile?
55% of all emails are opened on mobile devices, with some regions significantly higher or lower. The average open rate for emails is just 34.49% across all industries worldwide.
Email Marketing ROI Statistics
This section is for you if you’re looking for exciting email marketing ROI stats as a marketer.
1. What is the ROI of email marketing?
Email marketing delivers a strong ROI ranging from 10:1 to 50:1 for most companies, with many businesses earning around $36 for every $1 spent on email campaigns.

Here’s the email ROI by industry:
| Industry | Email Marketing ROI |
|---|---|
| Media, Publishing, Events, Sports & Entertainment | 32:1 |
| Software & Technology | 36:1 |
| Marketing, PR & Advertising Agencies | 42:1 |
| Retail, Ecommerce & Consumer Goods | 45:1 |
2. What is the average email open rate?
The average email open rate across major industries is 34.49%.
MailChimp reports that the highest open rates are found in non-profit emails, with an open rate of 40.04%.
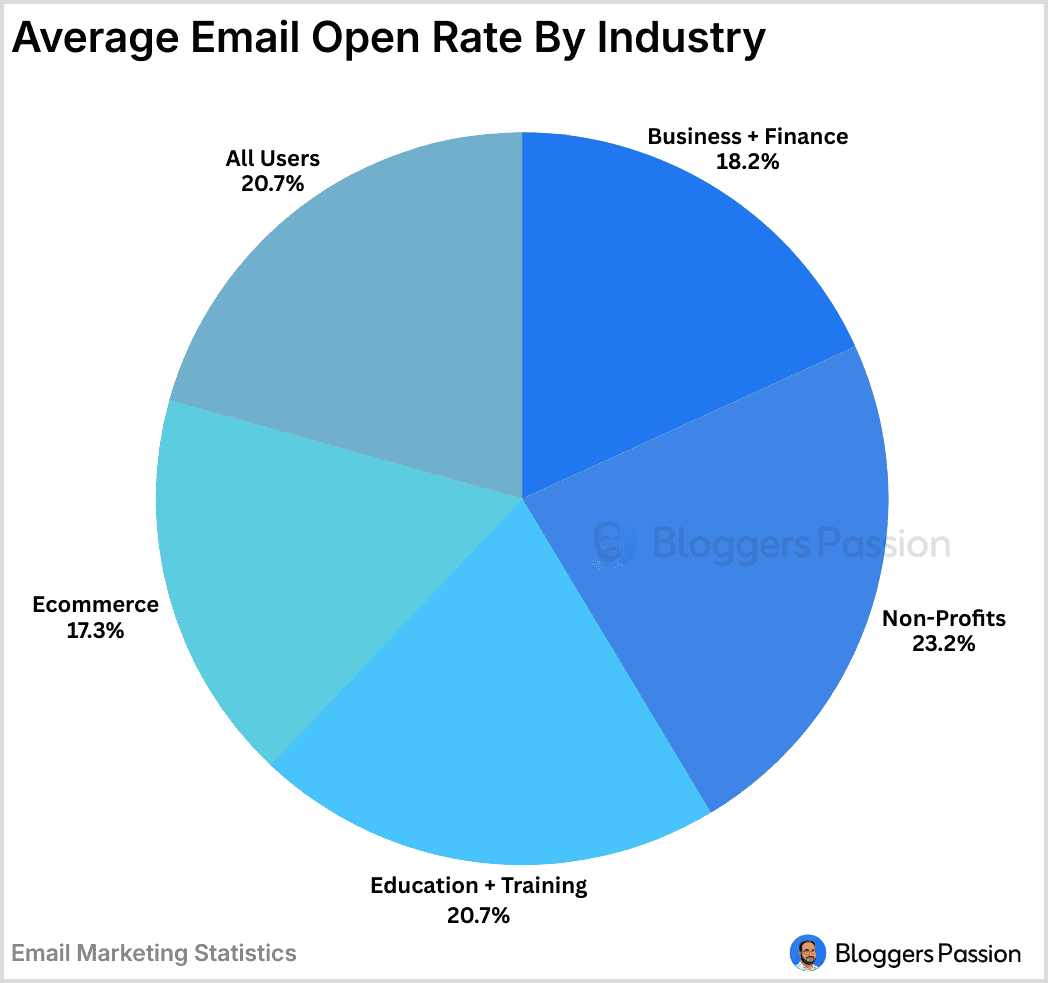
Email open rate measures the percentage of emails that are opened:
| Industry | Avg. Open Rate |
|---|---|
| Business + Finance | 31.35% |
| Non-Profits | 40.04% |
| Education + Training | 35.64% |
| Ecommerce | 29.81% |
| All Users | 35.63% |
3. What is the average email conversion rate?
As of 2026, the average conversion rate in email marketing is 2.9%.
Email conversion rate represents the percentage of subscribers who took a specific action, such as making a purchase or signing up for a service, after clicking through from the email.
4. Does email help you with cart abandonments?
According to the study, 10.37% of cart recovery emails lead to conversions. That’s much higher than the average email conversion rate (1.06%).

Tip: If people leave some products in the shopping cart and fail to go through the checkout process, send emails with special incentives or discounts to improve conversions.
5. What is the average unsubscribe rate in email marketing?
The average unsubscribe rate is less than 1% across various industries.
The unsubscribe rate is the percentage of subscribers who opted to unsubscribe from future emails.
It will vary depending on the frequency of emails, the quality of your newsletters, the timing of your emails, etc.
Sending too many emails is the reason 46.4% of people unsubscribe from an email newsletter.

6. What is the average CTR in email marketing?
MailChimp says the average email click-through rate across industries is 2.91%.
In case you’re curious, here are some of the industries with the highest click-through rates;
- Hobbies (5.01%)
- Media and Publishing (4.62%)
- Government (3.99%)
- Home and Garden (3.03%)
An email click-through rate (CTR) is the percentage of subscribers who clicked on one or more links in your email.
7. What are the biggest landing page challenges?
According to GetResponse, 45% of marketers struggle to generate traffic to their landing pages. 33% have poor conversion rates, 18% need help with A/B testing and optimization, and 16% need help with landing page copy and calls to action.
8. How long should an email be?
The average email contains 435 words and takes approximately 3 minutes to read. Subject lines have an average of 44 characters, and approximately 7% of subject lines include emojis.
9. What is the average email bounce rate?
The average bounce rate for marketing emails is around 2 to 3%. (Campaign Monitor)
This percentage can vary depending on the quality of the email list and the email service provider you use.
If you see bounce rates over 5%, you should consider changing your email marketing software. That’s why it’s extremely important to choose an email service platform with the highest deliverability rate.
In case you’re wondering, the email bounce rate is the percentage of email addresses in your email list that didn’t receive your newsletters for various reasons, such as spam complaints, flagged content, etc.
10. Do people like emails with specific offers?
Yes. According to LiveClicker, 55% of consumers like email messages that contain relevant products and offers.
B2B Email Marketing Statistics
Here are some of the latest B2B email marketing stats for 2026.
1. What are the benefits of birthday emails?
Did you know that birthday emails generate 342% higher revenue per email than promotional emails? Also, birthday emails have 179% higher click rates than promotional emails.
If you’re running a business or online store, make sure to collect your customers’ date of birth data. That way, you can send exclusive birthday emails with special incentives to generate more sales.
2. What are the statistics of triggered emails?
An Epsilon study reports that triggered emails get an average of 74.9% higher email open rates and 161.9% higher click-through rates than traditional bulk messages.
3. How many B2B marketers use email marketing?
81 to 93% of B2B marketers use email newsletters.
For most companies, email marketing is the most popular owned-media platform for content distribution after the website and social media.
4. What are the top 5 measures of email marketing success?
Content Marketing Institute reveals the top 5 metrics are delivery rate (36%), bounce rate (40%), conversion rate (67%), open rate (78%), and click-through rate in first place with (91%).
5. How do marketers drive traffic to their landing pages?
According to GetResponse, email is the biggest traffic source for most businesses’ landing pages (21%). However, 17% don’t use dedicated landing pages,16% of traffic comes from organic social media, and 14% of landing page traffic comes from organic search.
6. Do videos in email help with conversions?
Martech Advisor reports that including videos in your email content can increase your click rates by up to 300%.
Is Email Marketing Effective?
Here are some of the must-know email marketing statistics.
1. Are companies investing in email marketing?
According to the Litmus report, nearly 37% of companies intend to increase their overall investment in email, while only 1.3% plan to decrease their email budget.
2. What type of emails do most marketers send to their subscribers?
Newsletters (81%) and welcome emails (79%) are the most popular emails for marketers.
Also, according to HubSpot, over 4.5 billion people worldwide used email in 2026, and it is projected to reach over 4.8 billion by 2027!

3. Are people using AI in email marketing?
Litmus states that 33% of marketers use AI in marketing in general, and 39% plan to in the future.

As you can see above, here are some of the ways AI is used in email marketing;
- 70% in send time optimization
- 55% in segmentation and subscriber targeting
- 47% in content suggestions, product recommendations, etc
- 32% in writing personalized copy
4. How many times do marketers send emails?
About 45% of marketers send emails weekly, and about a third do it several times a week.

5. Do marketers send fewer emails if engagement is lower?
Yes. According to the Databox survey, over 72% of marketers reduce the mailing frequency for recipients who no longer open messages or click links.
Around 28% of marketers send users the same volume of emails regardless of user engagement.

6. What is the biggest challenge for most email marketers?
According to the GetResponse email marketing survey, the biggest challenges for most marketers are driving traffic to landing pages (45%) and poor conversion rates (33%).
For most people, email is the top traffic source (21%), ahead of organic social media (16%) and organic search (14%).
7. What is the average unsubscribe rate?
GetResponse states that the average email unsubscribe rate for all industries is 0.15%!
Dive into my post for in-depth insights on Websites and web hosting market.
8. Do marketers A/B test their emails?
20% of marketers tend to test offers, layouts, and copy. 16% of people test only alternative subject lines. 10% of marketers test performance by segment.
Email Personalization Statistics
Are you a fan of email segmentation? Looking for email personalization stats? Here are a few KEY stats you should know as a marketer.
1. What is the value of email segmentation?
Email segmentation is extremely important. DMA reports that segmented and targeted emails generate 58% of all revenue. More than a third (36%) of revenues were driven by emails sent to specific target selections.

2. Do segmented emails help with better open rates?
Yes, segmented personalized emails average 46% higher open rates than regular marketing messages. Also, personalized emails deliver 6x higher transactional rates.
3. What is the ROI of personalized emails?
Instapage reports that personalized email marketing generates a median ROI of 122%, which is extremely higher when compared to normal email newsletters (without personalization).
4. Do transactional emails help with sales?
Yes. Experian reports that transactional emails have 8x more email open rates and clicks than any other type of email and can generate 6x more revenue.
Litmus reports that 80% of customers are more likely to purchase a brand that provides personalized experiences. 83% of customers are willing to share their data to create a more personalized experience.
5. How do most people collect leads through landing pages?
45% of marketers include newsletter signup forms in landing pages to collect leads. 37% offer downloadable ebooks, whitepapers, infographics, etc., 23% promote product launches, and 20% invite attendees for webinars.
Also, in the internet marketing, arts, automotive, and health care industries, most businesses are using double opt-in to collect leads. (GetResponse)

6. What do marketers use in email signatures?
According to Moosend’s research about email signatures, 75% of them included contact information. 60% of people shared their phone numbers, and fewer had their social media profiles – Twitter (7%), Facebook (3%), and LinkedIn (2%).
7. What type of email marketing automation techniques do most people use?
A GetResponse survey found that marketers use automation for various emails, including multi-step welcome emails (47%), promotional campaigns (46%), and transactional emails (28%).
8. What are the benefits of email marketing automation?
30% of GetResponse respondents said saving time is the most significant benefit of marketing automation.
9. What is the data most marketers collect to send personalized emails?
80% of marketers personalize emails with profile data, and 64% personalize by customer segment.
Interestingly, Quora has over 400 million users. For more detailed insights, check out Quora Stats.
Final thoughts
Email marketing is extremely effective when done correctly. It allows YOU to communicate directly with your target audience, get feedback, improve sales, and more.
Remember, email marketing aims to engage your customers, not just send sales pitches.
Did you find our email marketing statistics helpful? Have any questions? Let us know in the comments.
FAQs
Here are some frequently asked questions about email marketing stats.
Email marketing is a marketing channel that uses email to promote your products or services. It is a form of direct marketing as you use emails to connect directly with your customers.
Yes, email marketing is one of the most effective ways to generate more sales. It also has the highest average ROI, $36 for every $1 spent. Simply put, if you invest a dollar and in return, you get 36 times from it.
CMI reports that 69% of marketers use email marketing to promote content and products.
Most businesses generate at least 25 to 35% of their total revenue from email. Statista reports that email marketing revenue will reach over $17.9 billion worldwide by the end of 2027.
As of 2026, average inbox placement ranges between 70 to 85% across industries.
Sources:


Leave a Comment
Your email address will not be published. Required fields are marked *