


In this review, I’ll share my 8+ years of experience running a live site on WPX hosting. The goal here is to share honest observations so you can decide whether WPX fits your needs.
To be honest, I am also an affiliate partner of WPX, so I’ll earn a commission if you purchase a WPX plan through my 80% discount link.
If you are in a hurry, jump to the conclusion and see whether WPX fits your needs.

WPX Hosting, established in 2013, is a company that specializes in hosting WordPress websites. It is considered a premium host because of its high pricing.
| WPX Hosting Pros | WPX Hosting Cons |
|---|---|
| “Fixed for You” Guarantee: Free malware removal and complete site restoration if your website gets infected. | Expensive Starter Tier with Weak Specs: The entry plan offers low CPU power and few PHP workers relative to its price. |
| Free Site Speed Optimization: WPX experts manually audit your site and tweak configurations to maximize performance. | Strict PHP Worker Caps (Backend Lag): The WordPress admin dashboard can crawl when team members edit heavy posts or run queries simultaneously. |
| Built-in Global XDN CDN: 41 endpoints provide fast global caching out-of-the-box, saving money on paid third-party CDNs. | No Automated Resource Auto-Scaling: Server resources are capped, requiring manual plan upgrades during unexpected viral traffic spikes. |
| Free Hands-Off Migrations: The WPX technical team handles site transfers completely without extra fees. | Zero Root Access & No cPanel: The custom locked-down environment restricts developers who need low-level server access. |
| Flat, Transparent Renewals: Renewal pricing remains identical to initial sign-up rates with zero hidden price hikes. | Staging Consumes Disk Quota: Staging environments occupy storage space directly from your main hosting plan’s SSD limit. |
| Daily Backups (28-Day Retention): Includes a full backup manager with daily automated snapshots retained for 28 days. | Missing UI Search & No Free Domain: The custom dashboard lacks a search bar, and plans do not include a free domain registration. |
| Beginner-Friendly Dashboard (4.7/5): A custom control panel designed for easy management without traditional cPanel complexity. |
Instead of trying to serve every hosting use case, WPX has stayed focused on WordPress users. Their two main specialties are their “Fix for You guarantee” and “Free Site Speed Optimization” services.
The “Fix for You” guarantee means their team steps in if a site goes down or faces technical issues. This support-first approach is one of the main reasons they retains long-term customers.
Their WooCommerce plans include extra resources and PHP workers to keep eCommerce stores running smoothly.
Their plans are shared based, but they offer dedicated resources to each individual site. This might be a problem for users who are looking solely for dedicated server hosting plans.
So that’s the basic intro; you can refer to the official WPX site to learn more about features.
Let’s dive into the main thing now.
Disclosure: We get a commission when you buy a product via our affiliate link at no additional cost.
Exploring WPX Hosting: The Ownership Review
Why Trust Us?
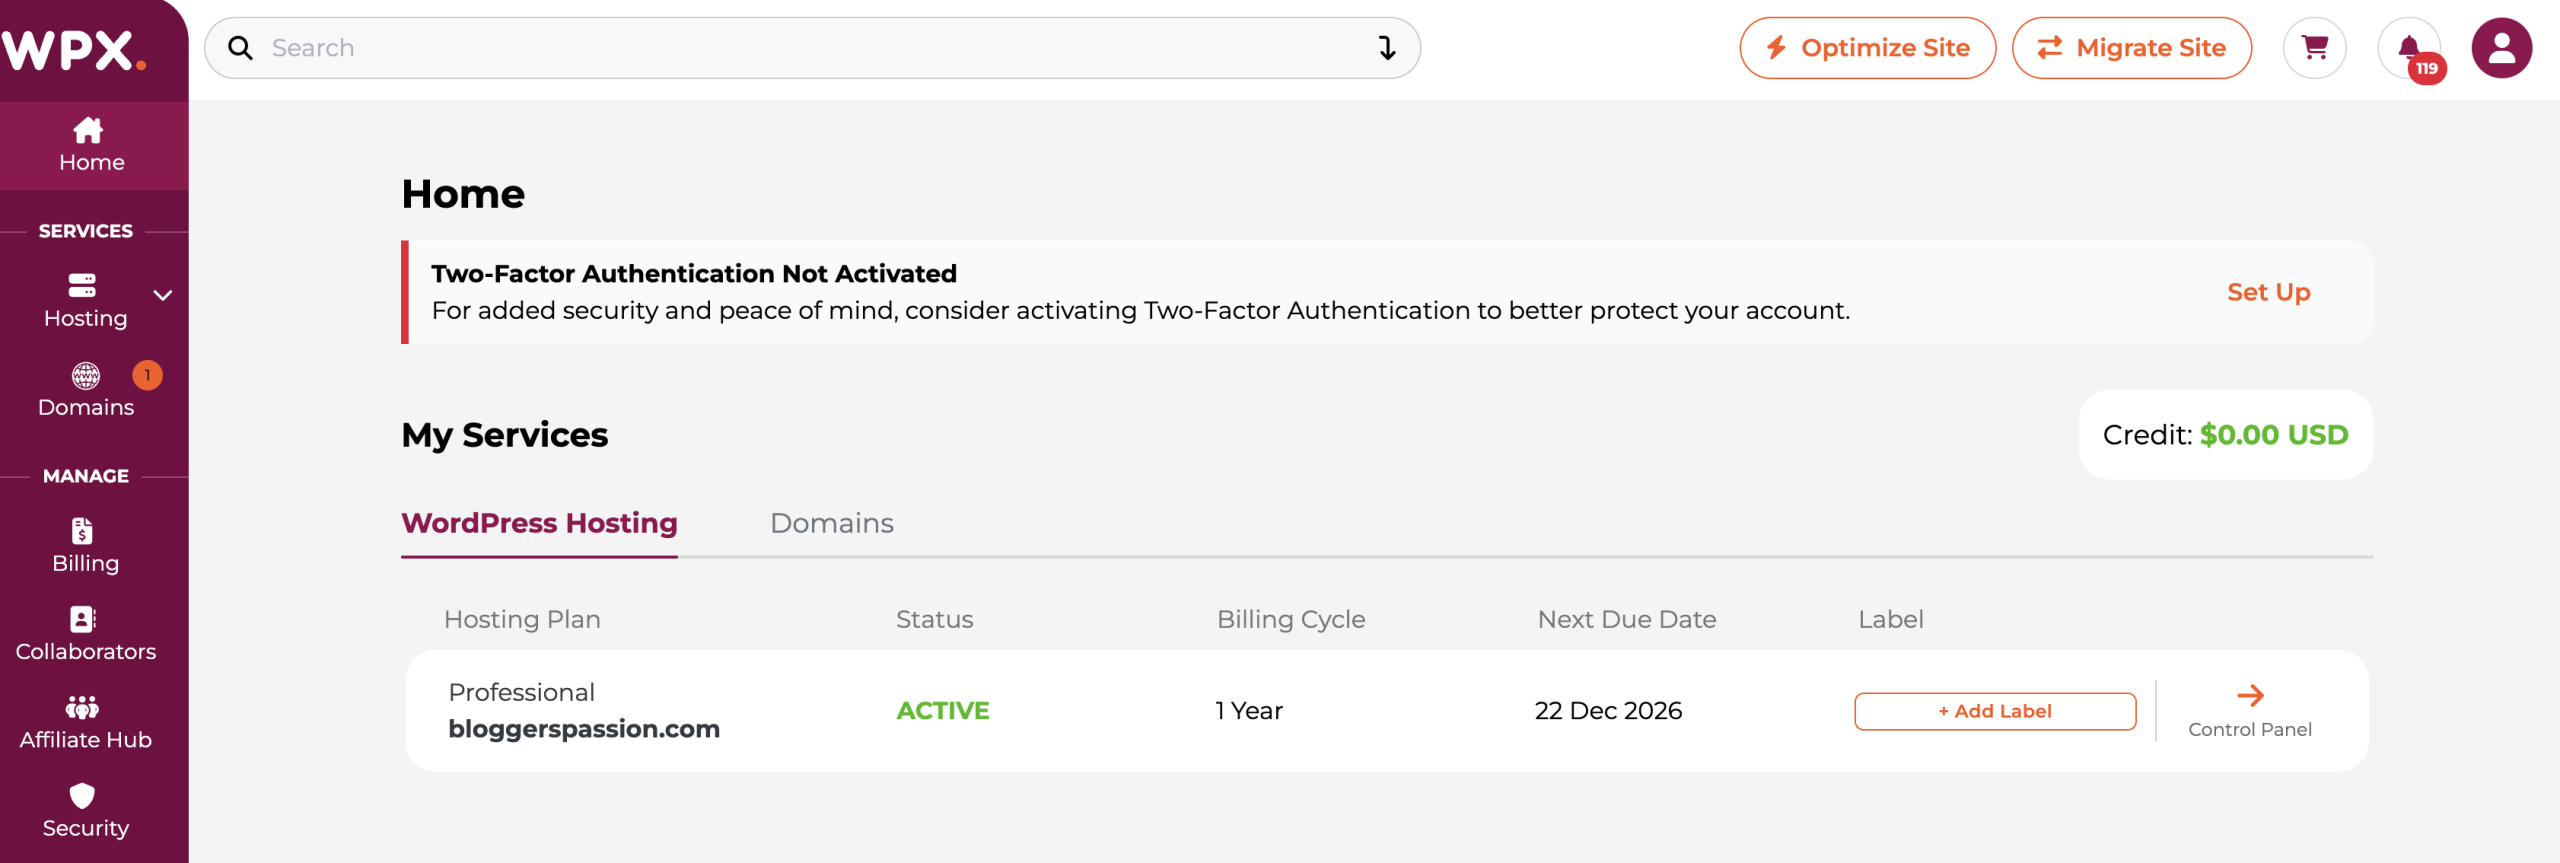
To prove the authenticity of our WPX Hosting review, we actively host our own website, BloggersPassion, on their servers.
Because of this, every performance test and hosting issue we share is based on real-world usage. Unlike other reviews that show fake or synthetic data, all our data is extracted using reputable, industry-standard tools like UptimeRobot, GTmetrix, and LoadTester.io.
To make this review more credible, we have explicitly benchmarked WPX Hosting against its top competitors. Our team at BloggersPassion has been reviewing different web hosting companies and plans for over 10 years—you can check any of our past hosting reviews to verify our testing methodology.
Detailed WPX Hosting Performance Assessment:
To evaluate WPX Hosting’s real-world performance, I tested my live website, BloggersPassion.com, which runs on WordPress WPX hosting. I assessed its page-loading speed across 10 global locations, reviewed its uptime history, and conducted a stress test to see how the server handled a sudden increase in traffic.
This combination gives a more complete picture of hosting performance than relying on a single speed test.
1. WPX Hosted Website and Testing Setup:
Here is the setup I used for the performance assessment:
| Test Parameter | Details |
|---|---|
| Test website | BloggersPassion.com (live website) |
| Hosting provider | WPX Hosting |
| WordPress theme | Astra |
| Caching plugin | WP Rocket |
| Active plugins | AdInserter, Advanced Custom Fields Pro, Akismet, Cloudflare, Convert Pro, Custom Post Templates, Easy Affiliate Links, Edit Author Slug, Melapress File Monitor, MyThemeShop, Rank Math, ShortPixel, Spectra Pro, SureForms, TablePress, and Ultimate Blocks |
| Uptime monitoring | UptimeRobot; monitoring has been in place since 2021 |
| Page speed testing tool | GTmetrix |
| Desktop test locations | Seattle, Chicago, São Paulo, London, Stockholm, Dubai, Johannesburg, Singapore, Hong Kong, and Sydney |
| Stress testing tool | k6 |
| Stress test configuration | 100 virtual users, with the load test running for approximately 5 minutes |
2. WPX Hosting Website Speed Test Results Across 10 Locations:
I used GTmetrix to monitor BloggersPassion across 10 global desktop locations. The data below averages 530 individual successful reports collected between August and October 2026.
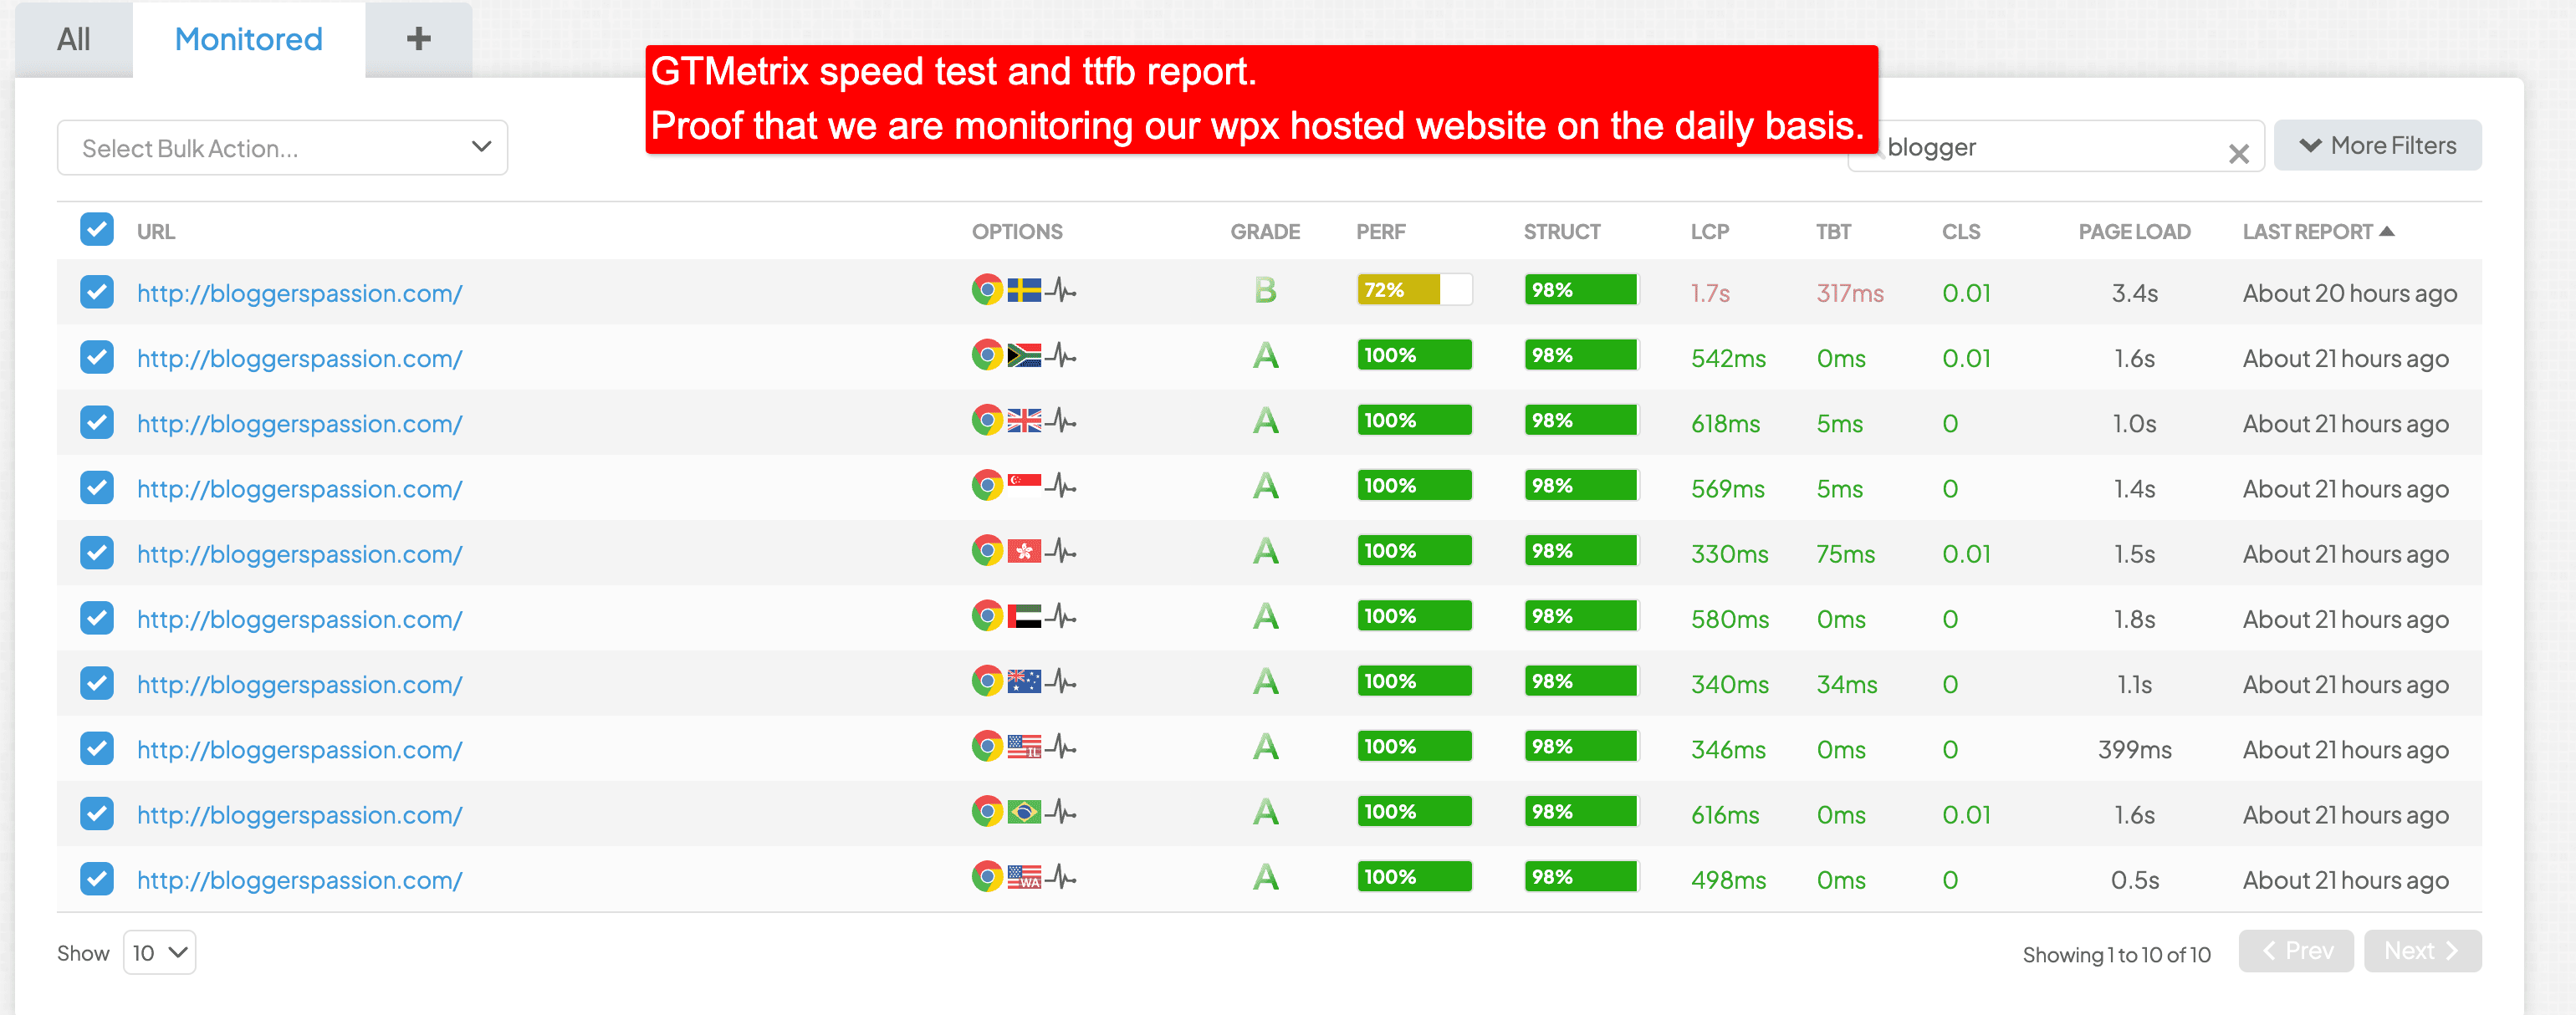
Quick Note: We will periodically update this table with the latest benchmarks.
Here are the average results from the historical reports:
| Location | Avg. GTmetrix Grade | Avg. Performance Score | Avg. LCP | Avg. TTFB | Avg. Fully Loaded |
|---|---|---|---|---|---|
| Chicago | 98.7% | 99.6% | 424 ms | 138 ms | 533 ms |
| Seattle | 98.9% | 99.8% | 446 ms | 99 ms | 636 ms |
| São Paulo | 98.7% | 99.5% | 489 ms | 120 ms | 1.05 s |
| London | 98.6% | 99.4% | 457 ms | 79 ms | 741 ms |
| Stockholm | 97.7% | 97.6% | 616 ms | 104 ms | 1.06 s |
| Dubai | 97.9% | 97.8% | 801 ms | 401 ms | 1.62 s |
| Johannesburg | 97.7% | 97.8% | 582 ms | 109 ms | 1.43 s |
| Singapore | 98.5% | 99.2% | 549 ms | 142 ms | 919 ms |
| Hong Kong | 98.5% | 99.3% | 527 ms | 116 ms | 1.08 s |
| Sydney | 98.8% | 99.6% | 412 ms | 58 ms | 1.03 s |
These are averages across the available reports for each location, not the result of one simultaneous test. LCP means Largest Contentful Paint, and TTFB means Time to First Byte.
What do these WPX hosting performance results tell us?
Excellent overall performance: All 10 locations recorded an average GTmetrix performance score above 97%. The average across the 10 location summaries was approximately 99%.
Fast loading in North America and Europe: Chicago and Seattle had average fully loaded times of approximately 533 ms and 636 ms, respectively. London’s average was around 741 ms.
Good results across most international locations: The average LCP was below one second at every location. This indicates that the largest visible content generally appeared quickly in these controlled desktop tests.
Dubai was the slowest location in the averages: Dubai recorded an average TTFB of around 401 ms, an average LCP of 801 ms, and a fully loaded time of approximately 1.62 seconds. Johannesburg also had a higher average fully loaded time than most other locations, at approximately 1.43 seconds.
These differences are worth noting because a website’s response time can vary by location, routing, caching, and network conditions.
Overall GTmetrix assessment:
Across all 10 locations, the average GTmetrix grade was approximately 98.4%, while the average performance score was approximately 99%. The average TTFB across the location summaries was around 136 ms, and the average LCP was approximately 530 ms.
These are strong results for this WPX website configuration.
3. WPX Uptime Monitoring and Reliability:
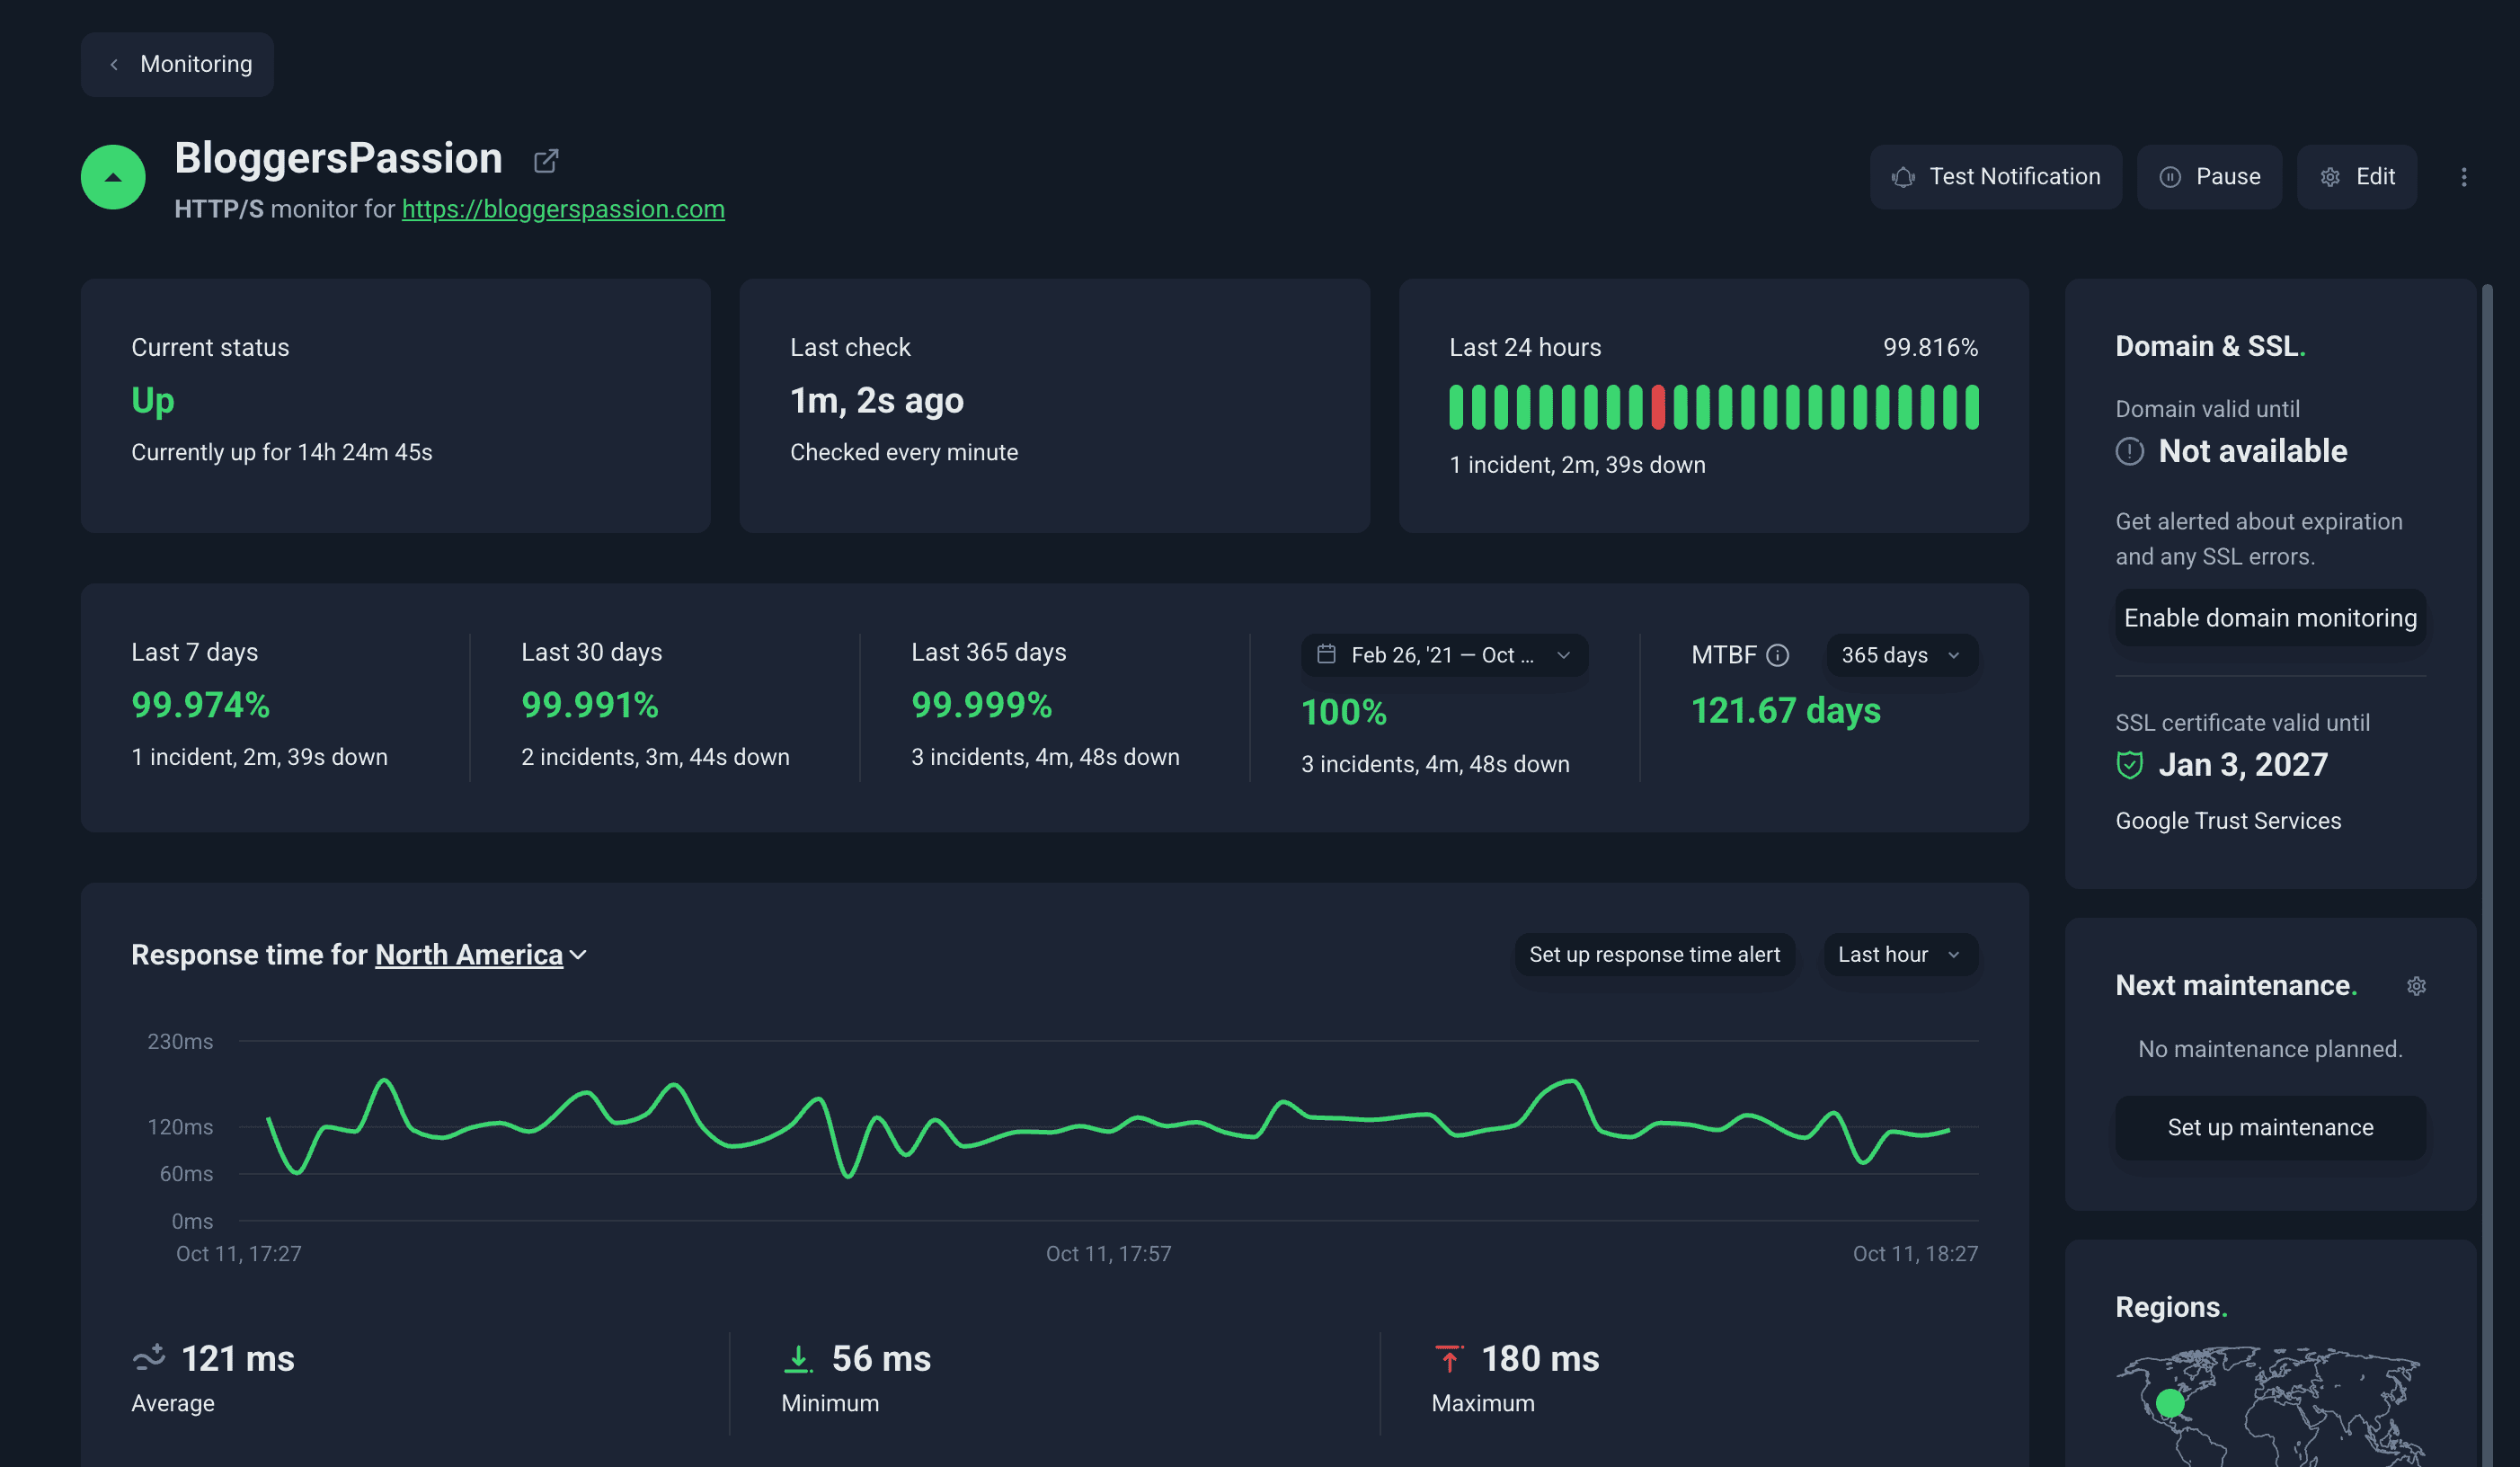
I have been monitoring BloggersPassion.com with UptimeRobot since 2021. Uptime monitoring checks whether the website is reachable and records incidents when the monitor detects a failure.
The supplied UptimeRobot dashboard screenshot showed the following availability figures:
| Monitoring Period | Reported Uptime |
|---|---|
| Last 24 hours | 99.816% |
| Last 7 days | 99.974% |
| Last 30 days | 99.991% |
| Last 365 days | 99.999% |
| September 2026 | 99.999% |
| August 2026 | 99.881% |
| July 2026 | 99.992% |
| June 2026 | 99.941% |
| May 2026 | 99.902% |
| April 2026 | 99.877% |
| March 2026 | 99.973% |
| Feb 2026 | 99.925% |
| Jan 2026 | 99.999% |
| December 2025 | 100% |
| November 2026 | 99.999% |
| October 2025 | 99.951% |
The dashboard also displayed a mean time between failures (MTBF) of 121.67 days over its selected 365-day view.
These figures indicate very high reported availability, particularly over the 30-day and 365-day periods. However, uptime percentages can change with the reporting window, and the screenshot represents the dashboard at the time it was captured.
What does the incident history show?
The supplied UptimeRobot incident export contained 22 incident records dated between January 2025 and October 2026. The records included connection timeouts, HTTP 500 errors, HTTP 521 errors, and HTTP 522 errors.
The combined duration of those 22 recorded incidents was approximately 1 hour, 18 minutes, and 15 seconds.
The longest recorded incident in this export occurred on May 20, 2025, and lasted approximately 24 minutes and 40 seconds. There was also a cluster of HTTP 500 errors on November 18, 2025, including two incidents lasting more than 10 minutes each. The remaining records were mostly short incidents.
These incidents do not necessarily mean the entire WPX hosting infrastructure was down. The export records failures detected by the website monitor; it does not independently establish the root cause of each incident.
WPX Uptime assessment:
The dashboard’s reported uptime is excellent, but the incident history shows that brief periods of unavailability have occurred. My assessment is therefore that BloggersPassion.com has demonstrated strong reported availability, with some historical incidents worth acknowledging rather than claiming uninterrupted uptime.
4. WPX Hosting Stress Test: 100 Virtual Users:
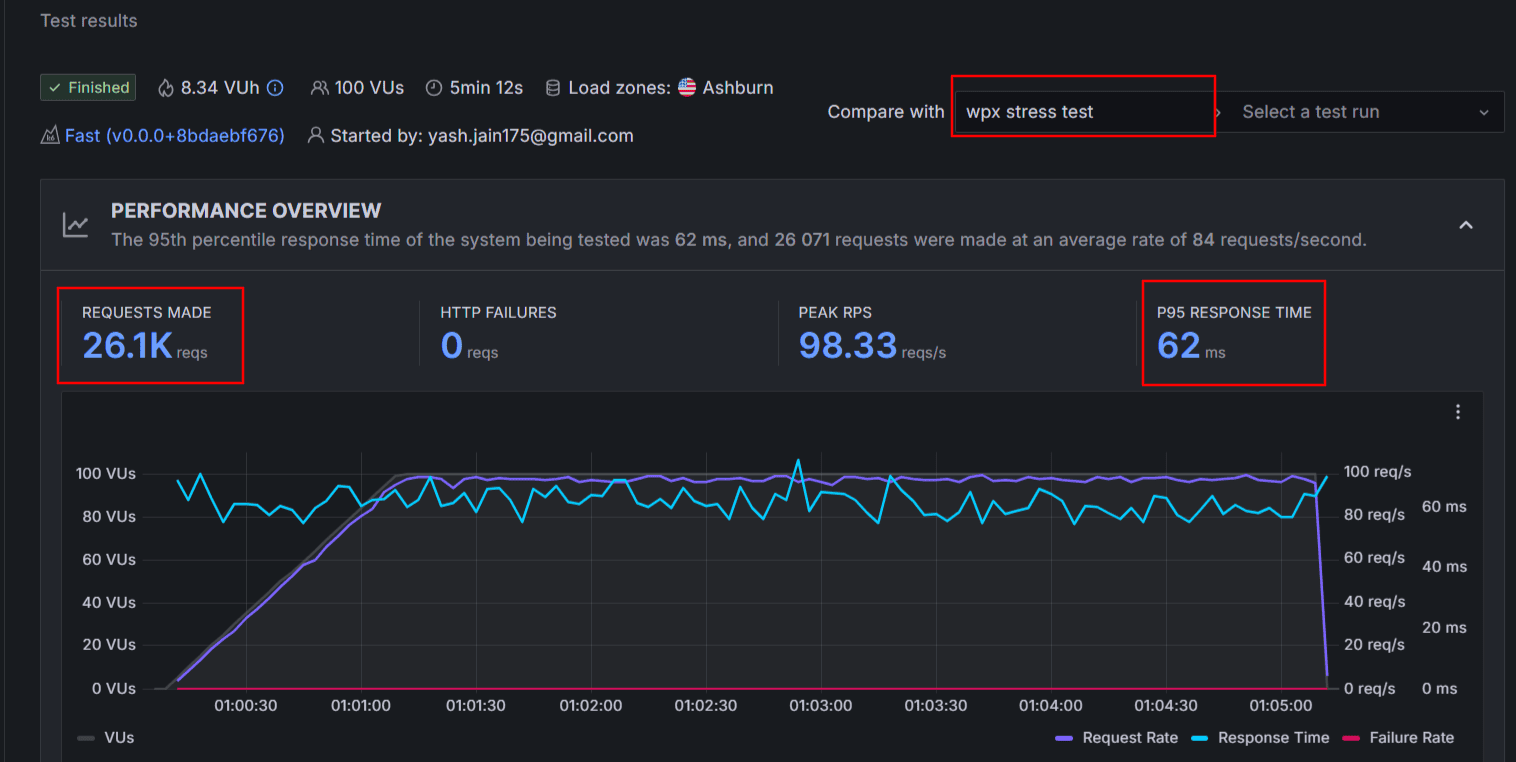
A speed test measures how quickly a website loads under controlled conditions. A stress test provides a different perspective by simulating concurrent activity and measuring how the system responds to a heavier workload.
I used k6 to run a stress test against my live website. The supplied test-results screenshot showed these results:
| Stress Test Metric | Result |
|---|---|
| Test status | Finished |
| Load zone | Ashburn, United States |
| Virtual users | 100 |
| Test duration | 5 minutes 12 seconds |
| Total requests | 26,071 |
| Average request rate | Approximately 84 requests/second |
| Peak request rate | 98.33 requests/second |
| 95th-percentile response time | 62 ms |
| HTTP failures | 0 |
What does this WPX Hosting stress test prove?
The results provide positive evidence that the tested website endpoint handled this particular simulated workload well. However, a single run with 100 virtual users does not establish the maximum traffic capacity of the server or guarantee that the site will handle every type of traffic spike without problems.
The result depends on factors such as the pages and endpoints requested, the request mix, caching, test configuration, and the workload generated by the script. The screenshot does not establish that the test used 100 distinct human visitors, nor does it show the number of database-heavy operations or authenticated user actions performed.
For that reason, I would describe the outcome as a successful stress test under the tested conditions, rather than proof that WPX can handle unlimited traffic.
5. WPX Performance Compared With Similar Hosting Service Providers
Along with WPX hosting, we have been monitoring performance results of its main players: Kinsta, WordPress.com, Cloudways, and Hostinger.
Here’s how WPX performance compared with these web hosting providers:
| Metric | WPX | Kinsta | WordPress.com | Cloudways | Hostinger |
|---|---|---|---|---|---|
| Avg. GTmetrix grade | 98.40% | 99.61% | 99.57% | 93.58% | 83.57% |
| Avg. performance score | 98.96% | 99.42% | 99.37% | 94.94% | 76.81% |
| Avg. structure score | 97.82% | 99.99% | 99.82% | 91.49% | 93.66% |
| Avg. LCP | 530 ms | 517 ms | 552 ms | 1,103 ms | 3,191 ms |
| Avg. TTFB | 136 ms | 198 ms | 103 ms | 629 ms | 557 ms |
| Avg. fully loaded time | 1.01 s | 678 ms | 679 ms | 5.13 s | 4.24 s |
| Avg. total page size | 453 KB | 310 KB | 386 KB | 1.79 MB | 1.13 MB |
| Avg. requests | 47 | 16 | 25 | 35 | 45 |
6. Final Performance Assessment of WPX Hosting Servers
Based on all the above WPX performance benchmarks, these are the positives we see:
- Average GTmetrix performance scores of approximately 98–100% across the 10 desktop locations.
- Average LCP below one second at every monitored location.
- Fast average TTFB in most locations, although Dubai was notably slower.
- Very high uptime percentages shown in the supplied UptimeRobot dashboard.
- A successful stress test that processed 26,071 requests with a p95 response time of 62 ms and no recorded HTTP failures.
There are also a few points to keep in perspective.
The incident export documents periods of unavailability, and the stress test represents one specific workload rather than a maximum-capacity test.
The results are evidence of how my website performed under these conditions; they are not a guarantee that every WPX customer or every WordPress installation will obtain the same results.
WPX Hosting Pricing & Alternatives (2026)
Unlike other hosts that play mind games with customers and try to steal more money, WPX is absolutely fair with its charges.
You will pay what you see. Renewal pricing is the same as the first-time price with no hidden charges.
However, WPX does not include a free domain name, so you will need to register your domain separately.
In my experience, the WPX Starter plan isn’t good. This is a new plan they recently introduced. I don’t recommend it, as it has serious issues with low CPU power and PHP workers.
1. The “True Cost” of Hosting: WPX vs. Budget Hosts (Hostinger)
Budget web hosts like Hostinger or Bluehost cost less per month on entry tiers.
When you host on a budget provider, security, email, and global CDN caching are either heavily limited or sold as separate add-ons. WPX includes these enterprise features by default in all their plans.
| Required Feature / Service | Budget Host (e.g., Hostinger) | WPX Hosting (Business / Pro Plans) |
|---|---|---|
| Base Managed Hosting | ~$3.99 / mo | Included in plan rate |
| Enterprise Malware Cleanups | ~$19.99 / mo (Sucuri / MalCare) | $0 (Included “Fixed For You” Guarantee) |
| Custom High-Speed Global CDN | ~$20.00 / mo (Cloudflare Pro) | $0 (Included 41-Point XDN CDN) |
| Business Email Hosting | ~$6.00 / user / mo (Google Workspace) | $0 (Included Unlimited Mailboxes) |
| Daily Automated Backups | ~$2.50 / mo | $0 (Included 28-day retention) |
| Total Effective Monthly Cost | ~$52.48 / month | $24.99 – $49.99 / month |
When you factor in $200+/year for malware cleanup services and $240/year for dedicated CDN bandwidth, cheap shared hosting quickly becomes more expensive than WPX’s all-inclusive environment.
2. Managed Tier Matchup: WPX vs. Kinsta vs. WP Engine:
WPX delivers higher site-per-dollar value compared to premium managed hosts like Kinsta and WP Engine.
| Metric | WPX Hosting (Business Plan) |
|---|---|
| Starting Monthly Price (Annual) | $24.99 / mo |
| $30 / mo (1 Site) to $83 / mo (5 Sites) | ~$19.99 / mo (Sucuri / MalCare) |
| $30 / mo (1 Site) to $109 / mo (10 Sites) | ~$20.00 / mo (Cloudflare Pro) |
| Websites Included | Up to 5 Websites |
| 1 to 5 Websites | 1 to 10 Websites |
| Storage Allocation | 20 GB SSD |
| 15 GB to 40 GB | 10 GB to 20 GB |
| Bandwidth Allocation | 200 GB |
| 15 GB to 65 GB | 75 GB to 240 GB |
| Included Business Email | Unlimited Mailboxes |
| ❌ Not Included (Requires 3rd Party) | ❌ Not Included (Requires 3rd Party) |
| PHP Workers / RAM | 15 PHP Workers / 5GB RAM |
| Unlisted / Dynamic Caps | Unlisted / Dynamic Caps |
WPX vs. Kinsta: Kinsta charges $83/month on its “Expand” plan just to host 5 websites with 65GB bandwidth. WPX gives you 5 websites and 200GB bandwidth for $24.99/month.
WPX vs. WP Engine: WP Engine’s $30/month “Startup” plan limits you to 1 website and 75GB bandwidth. To host up to 10 sites on WP Engine, you must jump to the $109/month “Growth” plan. On WPX’s $49.99/month Professional plan, you can host up to 15 websites with 400GB bandwidth.
Verdict: Should you choose WPX Hosting or avoid it?
If you are coming directly here, let me tell you that you have missed WPX benchmarks.
Anyway. So what’s my final verdict about WPX Hosting?
So yes, It’s been 8+ years with WPX. But let me tell you, WPX is not my first web host. If I remember, I started BloggersPassion with an entry-level host named HostGator.
But now, with both money and traffic coming in… I switched here.
WPX hosting is a great choice for anyone looking to upgrade from an entry-level host to something more serious and professional. WPX’s main goal is performance. And it comes with strong security and customer support.
That’s the main reason to go for it. No matter from where your traffic comes from on your site, WPX CDN handles easily. (Check Performance Section)
You can skip WPX Host if you just want to set up a simple business website with a few static pages for your customers. Spending this much money on a static site makes no sense.
Likewise, if your website is brand new or only pulling in 100 to 1,000 visitors a month, I strongly recommend sticking with an entry-level host.
At this stage, your site’s growth potential hasn’t been proven yet. Only make the switch to WPX once you see consistent traffic growth. Otherwise, honestly, there’s no need to upgrade.
Explore More:
- Best Web Host For Beginners [2026]
- Fastest Web Hosting [Full Performance Benchmarks]
- WPX Hosting Alternatives [2026]


Thank you for your review you made me want to test it and i did it through your link hope you get credited for that have a great day.