With a market share of over 89.94%, Google dominates the search engine market around the world.
To put this into perspective, 189,815 searches are made every second, that’s 16.4 billion daily and around 6 trillion each year!
As you can see, Google’s influence on consumer behavior and online marketing strategies is undeniable.
Here are the key highlights and insights into Google search statistics, user behavior, and growth rate.
Let’s get straight into it.
Table of Contents
- Top Google Search Statistics In 2026
- Google Search Statistics Worldwide 2026
- Google Search Statistics By Device
- Google Voice Search Statistics
- Google Lens Search Statistics
- Google Ads Statistics
- Google Local Search Statistics
- Google Search User Behavior Statistics
- Google SERP Statistics
- Google Search Growth Rate
- Google Search Revenue Statistics
- Final Thoughts
- FAQs on Google Search Statistics
Top Google Search Statistics In 2026
- Google receives 16.4 billion searches each day.
- Google’s search engine has a market share of over 89.94%.
- Last year, Google generated $403 billion in revenue.
- Google processes 11.39 million searches every minute.
- Google globally has a 90.06% share of the mobile search market and a 79.14% share of the desktop search market.
- As of 2026, the most-searched query on Google is “YouTube”.
- Google has a market share of over 83.92% in the United States, and Bing has a market share of 9.91%.
- In 2025, Google generated over $295 billion in revenue through advertising on its search service.
- 58% of the users aged between 25 and 34 prefer Google Voice Search daily.
- 96.55% of all indexed pages get zero traffic from Google. 1.94% of pages get between one and ten monthly visits.
Google Search Statistics Worldwide 2026
Google is the dominant search engine globally, with the highest market share in 2026. Here are some key statistics that highlight Google’s search landscape.
How Many Google Searches Per Day?
Around 16.4 billion searches occur on Google daily.
This means:
- Each month, Google.com attracts 492 billion searches globally.
- On average, Google receives 11.39 million searches each minute.
| Time Frame | Total Searches |
|---|---|
| Each second | 189,815 searches |
| Each minute | 11.39 million searches |
| Each hour | 683.3 million searches |
| Each day | 16.4 billion searches |
| Each month | 492 billion searches |
| Each year | 6 trillion searches |
- 92.96% of Google’s traffic comes from Search, Images, and Maps.
- 15% of searches on Google each day are entirely new.
(Source: Search Engine Land)
Google holds a market share of 89.94% among all the search engines worldwide.
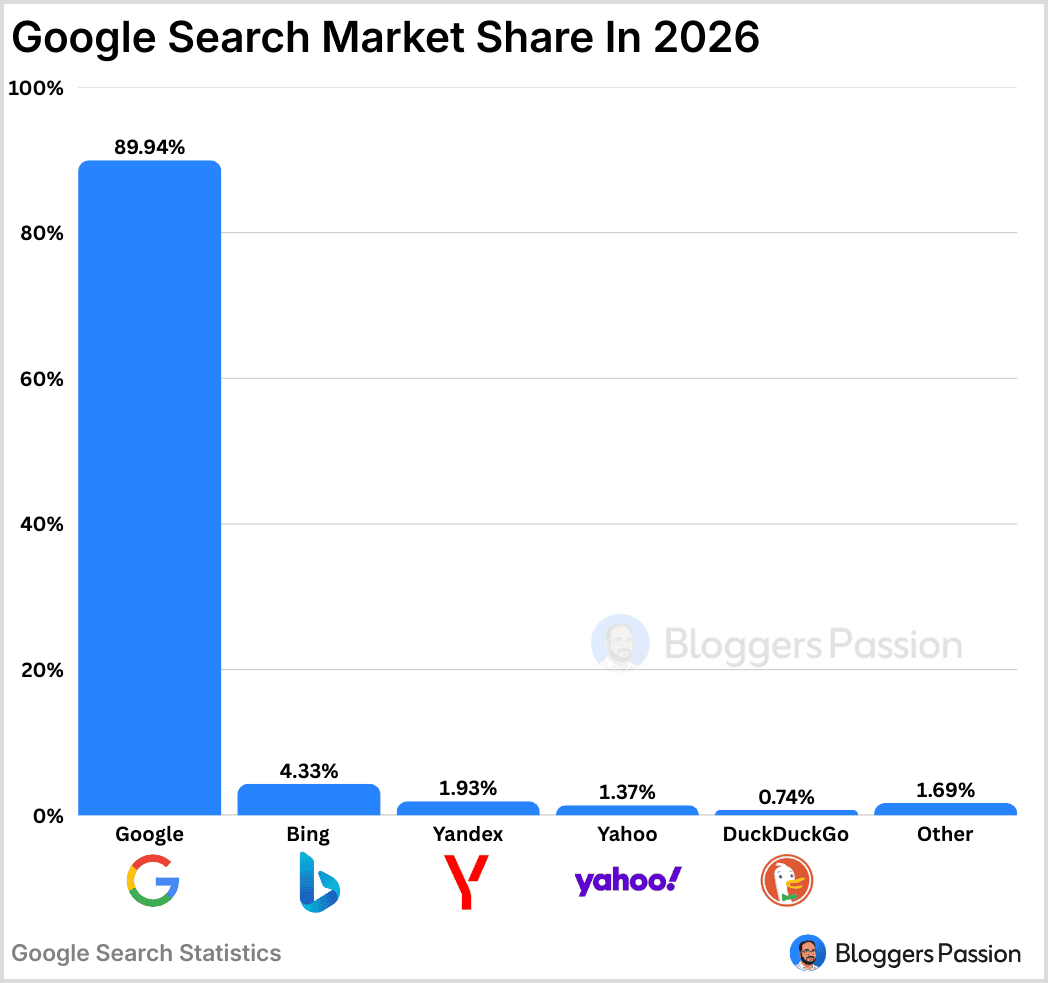
Let’s take a look at the market share of search engines globally. (Source: Stat Counter)
| Search Engine | Market Share |
|---|---|
| 89.94% | |
| Bing | 4.33% |
| Yandex | 1.93% |
| Yahoo | 1.37% |
| DuckDuckGo | 0.74% |
| Other | 1.69% |
While Google dominates search, Bing statistics show it’s still a strong #2, handling over 17% of U.S. desktop traffic.
- 9 out of 10 users globally choose Google search over other search engines.
- Google accounts for 63.41% of the web’s largest traffic referrers. (SparkToro)

- 84% of people use Google more than three times a day.
Here is how the market share of Google search looks over the years.
| Year | Google Search Engine Market Share |
|---|---|
| 2026 | 89.94% |
| 2025 | 89.74% |
| 2024 | 89.74% |
| 2023 | 91.54% |
| 2022 | 92.58% |
| 2021 | 91.94% |
| 2020 | 91.38% |
| 2019 | 92.71% |
Most Searched Terms On Google In 2026
- As of 2026, YouTube is the most searched term on Google.
- The next most popular searches are Amazon, Facebook, Weather, Google, and Gmail.
- Gmail has approximately 1.8 billion daily users and ranks as the 8th most searched term on Google.
- Canva’s monthly searches in Google are exploding with a 5-year search growth of 1,157%!
- “Weather” is one of the most searched queries on Google, with over 311 million searches worldwide.
Most Frequently Asked Questions on Google
As of 2026, “what is today?” was the most frequently asked question on Google, with 3.3 million searches each month.
- “What to watch” was the second most asked question on Google, with 2.7 million monthly searches.
(Source: Ahrefs)
Google Search Statistics By Device
Google market share by device:
Google holds 89.94% share of the global market, and 79.14% of Google searches happen on desktops.
| Device | Global Market Share |
|---|---|
| Mobile Devices | 94.03% |
| Desktop Devices | 82.79% |
- In the United States, mobile device searches hold 94.03% of the share.
- 82.79% of Google searches in the United States come from desktops.
- Approximately 45% of desktop users make their next move within five seconds of searching, while on mobile, this percentage decreases to 33%.
- On desktop, 25.6% of searches end without any clicks, whereas on mobile, this occurs for only 17.3% of searches.
- Images are 12.5 times more likely to appear in search results on mobile devices. In contrast, featured snippets and Google Ads are twice as common on desktop.
- 76% of smartphone users who search for something nearby visit a business within a day.
- Over the past two years, mobile searches for “store open near me” queries, such as “grocery store open near me,” have increased by 250%.
(Source: Stat Counter, Statista, Semrush, Ahrefs)
Google Voice Search Statistics
Google reports that almost 20.5% of the global online population uses voice searches.
Let’s take a look at some key voice search statistics.
- Nearly 28% of US and UK consumers claim to use voice assistants daily (Vixen Labs)

- Voice search is used every week by 33.6% of US internet users between 16 and 64 years old! (DataReportal)
- Nearly 98 million people in the US own a smart speaker in their household. Nearly half of smart speaker owners (43%) own three or more of the devices. (Edison Research)
- The top 3 devices where consumers use their voice assistants are: smartphones (56%), smart speakers (35%), and TVs (34%) (Edison Research and Backlinko)

- For local “near me” searches, 16% of individuals prefer using voice search.
- The Majority of Voice Searches Are for Weather, Music, and News.
- Over 20% of searches conducted in the Google App utilize voice search.
- Google Assistant has reached 1 million app installations.
- 52% of voice searches are primarily for getting directions while driving.
- 51% of voice searches are primarily used to initiate a call or send a text.
Google Lens Search Statistics
Google Lens is used 3,086 times per second.
This makes it a major player in Google searches. It assists in locating similar product images, extracting text, and more.
Let’s review further statistics about Google Lens.
- Each month, people use Lens for nearly 20 billion visual searches, and 20 percent of all Lens searches are shopping-related. (Google)
- 90.6% of all Google Lens results come from mobile-friendly websites. (Backlinko)

- Google Image Search has an estimated 136 billion indexed images.
- 3D images receive nearly 50% more clicks compared to static ones on Google.
- The decisions of 50% of online shoppers are mostly influenced by images in their purchasing process.
- Approximately 15.1% of Google SERPs feature images. (MozCast)
- Google Lens is also capable of translating text, with support for over 100 languages.
Related Read: Nearly 29.59% of Reddit’s audience is between 18 and 24 years old, making it a prime platform for brands targeting younger audiences. Full details in our Reddit statistics.
Google Ads Statistics
With its vast reach, Google Ads has become an essential tool for marketers looking to drive traffic, generate leads, and increase sales.
63% of users click on a Google ad while conducting their search.
Let’s understand the highlights of Google Ads and user behavior around them.
- Google Ads provides a return on investment (ROI) of 800%.
- Advertisers earn $8 in profit for every $1 spent on Google Ads, including both search and ads.
- Global digital ad spend amounted to $740 billion USD in the last year and is expected to reach $965 billion by 2028. (Oberlo)

- In the last year, U.S. search ad revenues surged to $102.9 billion!
- The average cost-per-click (CPC) for Google Ads in the U.S. is 6.56 USD.
- The highest-priced Google Ads keyword “how big is Cit Bank” commanded over $1K per click.
- Google is expected to make up 24.6% of the digital advertising market by 2026. (WebFX)
- The average shopping click-through rate (CTR) of Google Ads is 0.86%. The average conversion rate for PPC overall is 2.35%.
- Google Ads boasts an average shopping conversion rate (CVR) of 1.91% across all industries.
| Click-Through Rate (CTR) | 0.86% |
| Cost per click (CPC) | $6.56 |
| Conversion rate (CVR) | 1.91% |
Google Local Search Statistics
- Around 46% of all monthly Google searches have local intent.
As you see, Google local search has become increasingly important for businesses looking to attract customers.
Here are some key insights into the current state of Google local search.
- 8 out of 10 consumers prefer using Google to find local business information. (Backlinko)

- There are 48 billion local searches each month, averaging around 1.6 billion daily and approximately 18,519 local searches per second.
| Time frame | Searches |
|---|---|
| Per year | 584 billion |
| Per month | 48 billion |
| Per day | 1.6 billion |
| Per hour | 66.7 million |
| Per minute | 1.11 million |
| Per second | 18,519 |
- Each day, 21% of people in the US rely on Google to find local businesses.
- Google Search (72% share) and Google Maps (51% share) are the most frequently used tools for local search.

- Local mobile searches containing phrases like “can I buy” or “to buy” have surged by 500% in the past two years, according to Google.
- Global searches on Google Maps for “shopping near me” have more than doubled year over year, according to Google.
- The top listing in the local pack gets 17.6% of all clicks.
Google Search User Behavior Statistics
It’s no secret that Google is the go-to search engine for billions of people worldwide.
But did you know that only 7% of users actually browse through multiple pages to find what they are looking for?
Here are some insights into Google search user behavior statistics
- 25% of users choose the autocomplete suggestion.
- Only 0.63% of users navigate to the second page of Google search results.
- Only 9% of Google searchers make it to the bottom of the first page of the search results.

Here is what you need to know:
| Google Search User Behavior | % Of Users |
|---|---|
| Choose the autocomplete suggestion | 25% |
| Click on organic search results | 65% |
| Click on a Google Ad during their search | 19% |
| Navigate to the second page of Google search results | 0.63% |
| Reach the bottom of the first page of the search results | 9% |
| Modify their initial search terms | 15% |
| Bounced back to the search results | 17% |
| Visit a single page during their search session | 50% |
| Interact with a “People Also Ask” box | 3% |
- 60% of searchers tend to click on organic search results.
- About 65% of Google’s traffic comes from male users.
- On average, users take about 14.6 seconds to make their first click after starting a search. This metric reflects the time spent evaluating results before taking action. The time to first click also depends on the user’s query type.

- Over half (50%) of Google searches result in no clicks.
(Source: Backlinko)
Google SERP Statistics
As most online experiences begin with Google searches, they offer a powerful way to drive traffic to your website, blog, business, or any other online asset.
SEO helps you to rank your site higher in search results, which ultimately brings traffic.
Here are some key SERP statistics that you should check.
- 27.6% of all clicks go to #1st result on Google SERP.

- 65% of Google search users click on the organic search listings. The 10th result gets just 2.4%!
- Around 12.3% of search queries include a featured snippet.
- Only 0.44% of users go to the second page of Google SERP.
- 50% of Google users initiate a click within 9 seconds of their search.
- Leads generated through SEO have a close rate of 14.6%.
| Google Search Result’s Position | CTR Rate Recorded By Result |
|---|---|
| 1 | 27.6% |
| 2 | 15.8% |
| 3 | 11.0% |
| 4 | 8.4% |
| 5 | 6.3% |
| 6 | 4.9% |
| 7 | 3.9% |
| 8 | 3.3% |
| 9 | 2.7% |
| 10 | 2.4% |
Semrush’s 26 billion keywords are providing deeper insights into Google Search terms. Get more insights on Semrush Statistics here.
Google Search Growth Rate
Google Search has experienced significant growth since its inception, with a steady increase in the number of searches conducted on its platform.
- The current Google search growth rate is estimated at around 20%.
- Google Search continues to grow, though its growth rate has slowed compared to earlier years

Here is the historical growth rate in Google search.
| Year | Growth Rate |
|---|---|
| 1999-2000 | 1000% |
| 2000-2001 | 200% |
| 2001-2009 | 40% to 60% |
| 2009-2012 | 10% to 15% |
| 2012-2023 2024 | 10% 21.64% |
(Source: SparkToro)
Did you know? Currently, 80.49 million websites use Google Hosting. Check out the web hosting stats to see how Google is dominating the market!
Google Search Revenue Statistics
- As of 2026, Alphabet (Google) has a market cap of $3.924 trillion.
- In the last year, Google’s total revenue amounted to $403 billion, which is the highest to date.
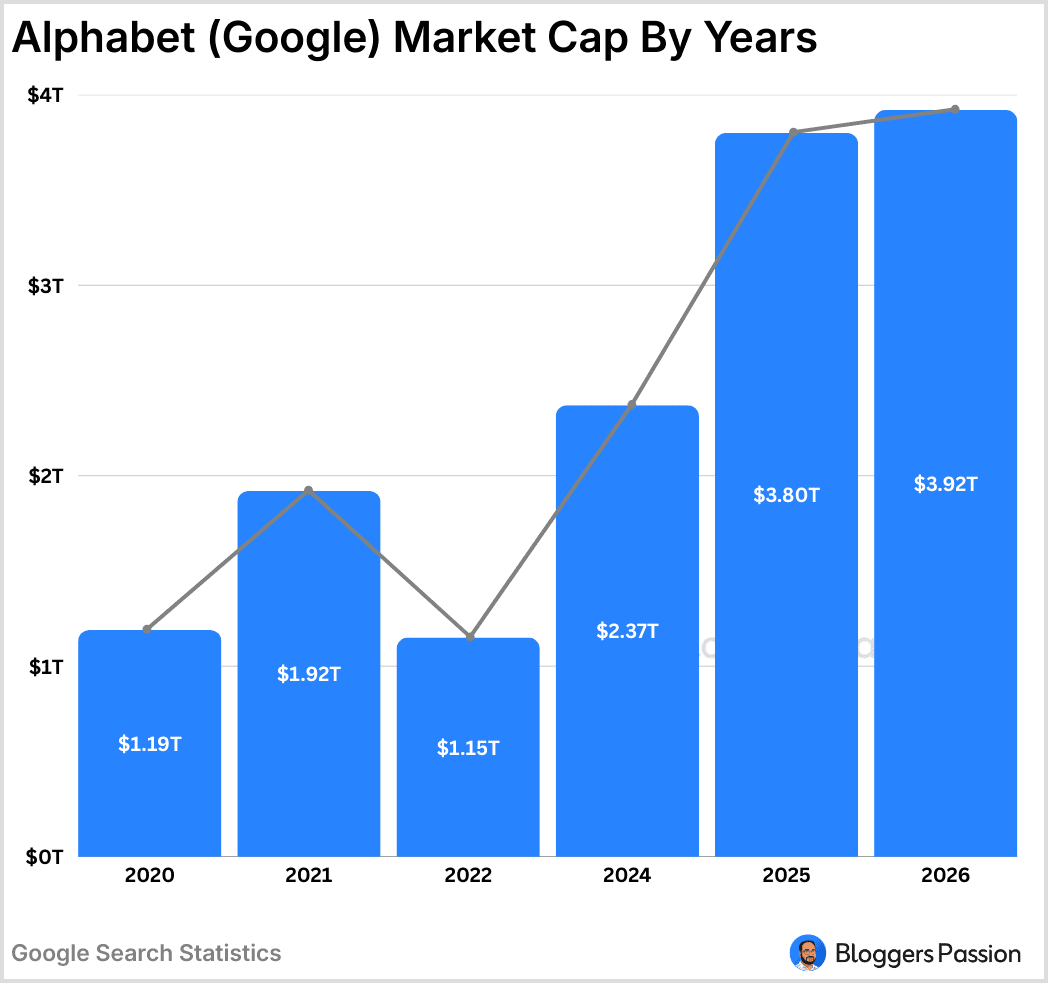
Take a look at the market cap of Alphabet (Google) over the years:
| Year | Marketcap | Change |
|---|---|---|
| 2026 | $3.924 T | 3.21% |
| 2025 | $3.802 T | 60.74% |
| 2024 | $2.365 T | 34.64% |
| 2023 | $1.756 T | 53.43% |
| 2022 | $1.145 T | -40.27% |
| 2021 | $1.917 T | 61.74% |
| 2020 | $1.185 T | 28.68% |
| 2019 | $921.13 B | 27.31% |
Source: (Companies Market Cap)
- In the last year, Google generated $295 billion in advertising revenue from its websites, including Google Ads revenue model, search, and YouTube.
- The network sites of Google generated advertising revenue of $30.36 billion as of Q4 2024.
- Alphabet (Google) is currently the world’s 3rd most valuable company by market cap.
Take a look at the advertising revenue of Google websites and Google network websites over the years.
| Year | Advertising Revenue of Google Websites (in billion dollars) | Google network Websites Advertising Revenue (in billion dollars) |
|---|---|---|
| 2025 | $295 billion | N/A |
| 2024 | $264.59 billion | $30.36 billion |
| 2023 | $206.54 billion | $31.31 billion |
| 2022 | $191.69 billion | $32.78 billion |
| 2021 | $177.79 billion | $31.7 billion |
| 2020 | $123.83 billion | $23.09 billion |
| 2019 | $123.83 billion | $21.55 billion |
| 2018 | $113.26 billion | $20.01 billion |
(Source: Statista)
- Google is investing more in AI (Gemini) across Search, Chrome, and Gmail to increase engagement and ad revenue.
Related Reads:
Final Thoughts
So, here we are with the latest Google search statistics.
Seeing the Google search data and trends above, one thing is clear: Google will continue to lead the search engine market globally. With over 584 billion local searches per year, Google’s reach is unparalleled
Moreover, Google’s recent AI integration assures that search results are increasingly personalised and relevant.
No doubt, Google will remain a popular search engine with many future advancements.
What are your thoughts on this? Let us know in the comments section below.
FAQs on Google Search Statistics
Here are some of the frequently asked questions on Google search statistics.
How many people use Google per day?
Each day, Google receives 16.4 billion search queries globally.
What is the #1 searched thing on Google?
As of 2026, the most searched term on Google globally is “YouTube”, with an average monthly search volume of approximately 151 million.
What was the first thing Googled?
In 1998, the first Google search was for ‘Gerhard Casper’, the president of Stanford at the time.
What is the most searched question on Google?
“What is today?” is the most searched question on Google. This question received 3.03 million monthly searches.
Who is the most searched person on Google?
As of 2026, Trump is the most searched person on Google with 9.1 million US searches.
